October 8, 2014
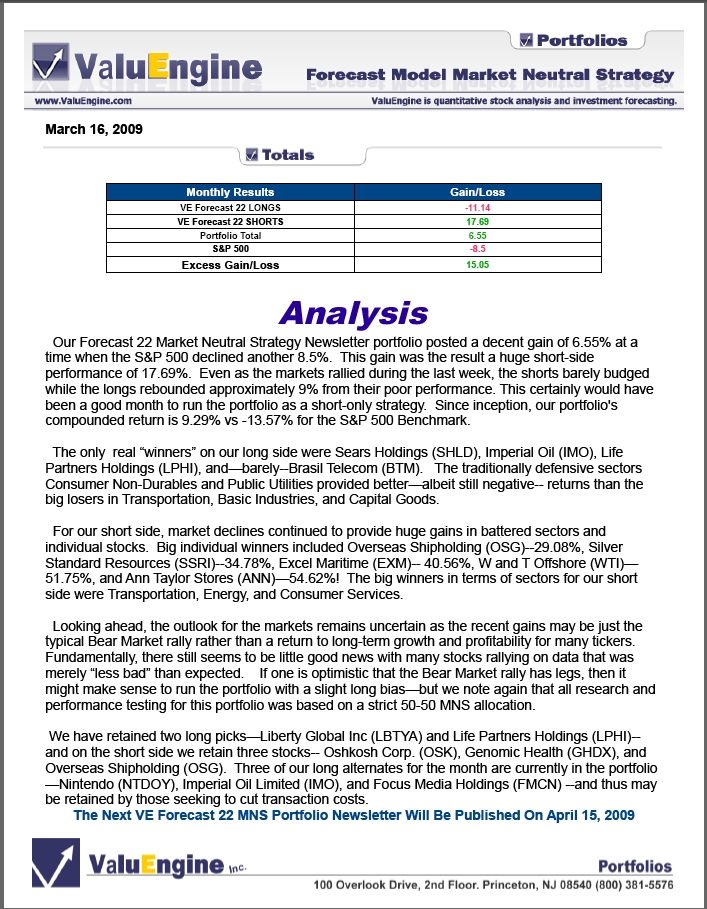
Click HERE to Download a FREE Sample of the ValuEngine View NewsletterVALUATION WATCH IS OFF: Overvalued stocks now make up 46.64% of our stocks assigned a valuation and 12.9% of those equities are calculated to be overvalued by 20% or more. Eleven sectors are calculated to be overvalued. How Low Can It Go?--ValuEngine STRONG SELL Sears Holdings Takes Another Tumble Sears Holdings Corporation (SHLD), the parent of Kmart and Sears, Roebuck and Co., is the leading home appliance retailer in North America and is a retail sales leader in tools, lawn and garden, home electronics, and automotive repair and maintenance. Key proprietary brands include Kenmore, Craftsman and DieHard, and a broad apparel offering, including such well-known labels as Lands' End, Jaclyn Smith and Joe Boxer, as well as the Apostrophe and Covington brands. Sears had some more trouble today after Bloomberg News reported that a vendor had stopped shipments to the company over fears related to financing and insurance--credit insurance, says Bloomberg, is getting scarce. In response to the news, shares in the company fell more than 15%--as of this writing shares are down @8%. Without some sort of insurance, vendors are worried that they may be stuck if Sears were to declare bankruptcy. Sears, for its part, notes that it has never made a late payment to a vendor and that they have ample resources to pay vendors. The company announced just last week that palns to sell off a large portion of Sears Canada would raise more than $350 million. Our models have been down on the stock for most of the year so far, and we continue our STRONG SELL recommendation on Sears Holdings Corporation for 2014-10-07. Based on the information we have gathered and our resulting research, we feel that Sears Holdings Corporation has the probability to UNDERPERFORM average market performance for the next year. The company exhibits UNATTRACTIVE P/E Ratio and Momentum. Below is today's data on SHLD: 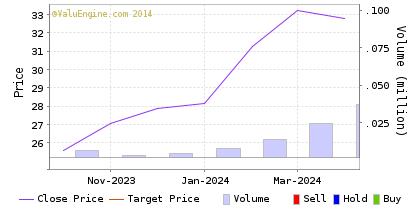
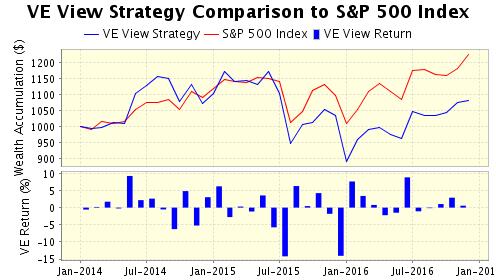
For July/August, the ValuEngine View worked its way to a decent gain of 2.62% vs a flat S&P500 return. The trailing 12 month gain of the VE View is 36% versus the S&P 500 return of 19.93%. The return since inception of the View is 130% versus the S&P's gain of 75%. While ValuEngine offers numerous ready-to-trade portfolios and newsletters designed for every risk/reward profile and every investment style, the View is our best performing newsletter under current market conditions.
The View features the absolute top quality picks from our extensively tracked and tested quant models. It is the only newsletter which features picks from both the ValuEngine Stock Valuation and Forecast Model. With the View, investors can utilize the power of ValuEngine to achieve their goals in a steady and consistent manner.
With the ValuEngine View Newsletter you Receive 20 Carefully Selected Stock Picks
We had six winners this month—most of them in double-digit territory. Despite some early wobbles, Canadian Solar led the way with a nice 20% pick up followed closely by E-House China with a pick up of 18.63%. We also garnered good returns from Soufun, Huntington Ingalls, and Aercap Holdings. Here are the latest results from June/July 2014:
Our Investment Strategies Focus on Dozens of Fundamental and Technical Factors for over 7,000 Individual Stocks, Synthesize the Data, and then Come Up with a Portfolio Looking for a monthly portfolio of stock picks which are objective and based on cutting-edge academic theory and Wall St.practice? Then subscribe to The ValuEngine View Newsletter.The ValuEngine View Portfolio is based on our highly-refined and tested ValuEngine Portfolio Strategies along with our proprietary quant-based composite scoring system. The ValuEngine View Newsletter is the product of sophisticated stock valuation and forecast models first developed by Yale Professor of Finance Zhiwu Chen.
The ValuEngine View Newsletter is derived from the ValuEngine Aggressive and Diversified Growth Benchmark CLICK HERE to Subscribe to the ValuEngine View The ValuEngine View Newsletter portfolio has 15 primary stock picks and five alternates and is re-balanced once each month. The ValuEngine View Newsletter is published near the middle of each calendar month. An equal amount of capital is allocated to each stock. The monthly returns are calculated from the closing prices on date of publication. The performance calculation does not include any transaction costs.
ValuEngine Market Overview
ValuEngine Sector Overview
ValuEngine.com Products and Services
|
||||||||||||||||||||||||||||||||||||||||||||||||||||||||||||||||||||||||||||||||||||||||||||||||||||||||||||||||||||||||||||||||||||||||||||||||||||||||||||||||||||||||||||||||||||||||||||||||||||||||||||||||||||||||||||||||||||||||||||||||||||||||||||||||||||||||||||||||||||||||||||||||||||||||||||||||||||||||||||||||||||||||||||||||||||||||||||||||||||||||||||||||||||