October 23, 2014
ATTENTION
Advanced Investors and Finance Professionals:
If you are reading this you should download ValuEngine
Institutional Software to see how VEs powerful quantitative
tools can increase your productivity and effectiveness. |
VALUATION WATCH IS OFF: Undervalued stocks now make up 51.97% of our stocks assigned a valuation and 18.59% of those equities are calculated to be undervalued by 20% or more. Five sectors are calculated to be overvalued.
MMMh...
--3M Boosts Profits, ValuEngine Still Rates it a HOLD
3M Company is a diversified technology company with leading positions in consumer and office; display and graphics; electronics and telecommunications; health care; industrial; safety, security and protection services; transportation and other businesses. They are an integrated enterprise characterized by substantial intercompany cooperation in research, manufacturing and marketing of products.
3M is another earnings week success story. The company posted excellent numbers today and provided a nice beat with Q3 profits up almost six percent. CEO Inge Thulin noted that much of the good news was based on US sales, where a strong economy helped product lines related to auto, aircraft, and electronic manufacturing. She also noted a boost from the sale of the company's protective dust and respiratory masks.
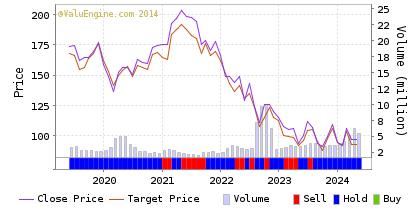
ValuEngine continues its HOLD recommendation on 3M CO for 2014-10-22. Based on the information we have gathered and our resulting research, we feel that 3M CO has the probability to ROUGHLY MATCH average market performance for the next year. The company exhibits ATTRACTIVE Company Size but UNATTRACTIVE Book Market Ratio.
Below is today's data on MMM:
ValuEngine Forecast |
| |
Target
Price* |
Expected
Return |
1-Month |
138.63 |
-0.23% |
3-Month |
138.25 |
-0.51% |
6-Month |
138.33 |
-0.45% |
1-Year |
135.17 |
-2.72% |
2-Year |
149.35 |
7.49% |
3-Year |
118.59 |
-14.65% |
Valuation & Rankings |
Valuation |
11.89% overvalued |
|
 24 24 |
1-M Forecast Return |
-0.23% |
1-M Forecast Return Rank |
33 |
12-M Return |
12.24% |
|
74 |
Sharpe Ratio |
0.76 |
|
89 |
5-Y Avg Annual Return |
13.04% |
5-Y Avg Annual Rtn Rank |
77 |
Volatility |
17.24% |
|
87 |
Expected EPS Growth |
9.07% |
|
32 |
Market Cap (billions) |
90.91 |
Size Rank |
100 |
Trailing P/E Ratio |
19.09 |
|
59 |
Forward P/E Ratio |
17.50 |
Forward P/E Ratio Rank |
35 |
PEG Ratio |
2.11 |
PEG Ratio Rank |
16 |
Price/Sales |
2.89 |
|
32 |
Market/Book |
10.31 |
|
12 |
Beta |
1.11 |
Beta Rank |
46 |
Alpha |
-0.01 |
Alpha Rank |
65 |
ValuEngine Market Overview
Summary of VE Stock Universe |
Stocks Undervalued |
51.97% |
Stocks Overvalued |
48.03% |
Stocks Undervalued by 20% |
18.59% |
Stocks Overvalued by 20% |
13.29% |
ValuEngine Sector Overview
|
|
|
|
|
|
|
|
-1.24% |
-0.01% |
-0.15% |
6.73% overvalued |
5.66% |
23.05 |
|
-0.77% |
-2.63% |
-3.00% |
6.18% overvalued |
0.40% |
21.18 |
|
-1.18% |
-0.63% |
-7.39% |
4.67% overvalued |
-3.77% |
23.54 |
|
-0.68% |
-0.06% |
8.36% |
4.49% overvalued |
12.33% |
29.61 |
|
-0.64% |
-1.37% |
-6.12% |
4.40% overvalued |
-1.14% |
26.91 |
|
-0.62% |
-0.22% |
1.77% |
4.26% overvalued |
3.15% |
17.20 |
|
-1.16% |
-1.88% |
3.22% |
4.25% overvalued |
11.25% |
19.04 |
|
-0.95% |
-0.16% |
5.08% |
3.64% overvalued |
4.17% |
21.03 |
|
-0.80% |
-4.08% |
-5.24% |
2.58% overvalued |
12.22% |
20.61 |
|
-1.45% |
-4.40% |
-1.82% |
1.84% overvalued |
0.40% |
30.18 |
|
-0.64% |
0.03% |
-1.85% |
0.24% overvalued |
2.05% |
24.23 |
|
-0.98% |
-1.90% |
-6.13% |
2.05% undervalued |
-0.01% |
22.02 |
|
-1.11% |
-4.27% |
-5.66% |
3.70% undervalued |
-4.29% |
15.71 |
|
-0.98% |
-0.17% |
-3.97% |
6.41% undervalued |
-0.08% |
23.85 |
|
-2.14% |
-9.74% |
3.53% |
9.09% undervalued |
-8.20% |
24.16 |
|
-1.61% |
-3.95% |
-4.59% |
9.23% undervalued |
-7.07% |
25.02 |
ValuEngine.com Products and Services
With the ValuEngine Forecast 16 Market Neutral Strategy Portfolio Newsletter, you can run your own portfolio like a hedge fund to manage risk and profit in any market environment. |
|
|
With ValuEngine.com's Premium Website Membership you get forecasts, valuations, and recommendations on more than 7,000 stocks updated every trading day!
NO OBLIGATION, 30-DAY FREE TRIAL! |
|
 |

|