November 6, 2014
ATTENTION
Advanced Investors and Finance Professionals:
If you are reading this you should download ValuEngine
Institutional Software to see how VEs powerful quantitative
tools can increase your productivity and effectiveness. |
VALUATION WATCH IS OFF: Overvalued stocks now make up 59.01% of our stocks assigned a valuation and 19.39% of those equities are calculated to be overvalued by 20% or more. Twelve sectors are calculated to be overvalued--one by double digits.
Good Optics
--AU Optronics Up More than 20% for ValuEngine View
Au Optronics (AUO) is a world-leading manufacturer of large-size thin film transistor liquid crystal display panels, which are currently the most widely used flat panel display technology. They are used in notebook computers, desktop monitors, televisions, digital cameras, DVD players, PDAs, mobile phones, portable games, and car navigation systems, among other applications.
AU Optronics is currently leading our ValuEngine View Newsletter portfolio with a gain of more than 20%. ValuEngine continues its BUY recommendation on AU OPTRONCS-ADR for 2014-11-05. Based on the information we have gathered and our resulting research, we feel that AU OPTRONCS-ADR has the probability to OUTPERFORM average market performance for the next year. The company exhibits ATTRACTIVE P/E Ratio and Momentum.
As a bonus to our Newsletter readers,
we are offering a FREE DOWNLOAD of one of our Stock Reports
Read our Complete Detailed Valuation Report on AU Optronics HERE.
Below is today's data on AUO:

ValuEngine Forecast |
| |
Target
Price* |
Expected
Return |
1-Month |
4.93 |
1.76% |
3-Month |
5.10 |
5.39% |
6-Month |
5.34 |
10.36% |
1-Year |
5.86 |
21.08% |
2-Year |
6.15 |
27.03% |
3-Year |
2.97 |
-38.62% |
Valuation & Rankings |
Valuation |
18.87% undervalued |
|
 83 83 |
1-M Forecast Return |
1.76% |
1-M Forecast Return Rank |
100 |
12-M Return |
53.16% |
|
92 |
Sharpe Ratio |
-0.30 |
|
26 |
5-Y Avg Annual Return |
-12.23% |
5-Y Avg Annual Rtn Rank |
30 |
Volatility |
40.78% |
|
48 |
Expected EPS Growth |
-0.00% |
|
17 |
Market Cap (billions) |
4.66 |
Size Rank |
83 |
Trailing P/E Ratio |
10.37 |
|
93 |
Forward P/E Ratio |
10.37 |
Forward P/E Ratio Rank |
82 |
PEG Ratio |
n/a |
PEG Ratio Rank |
n/a |
Price/Sales |
0.34 |
|
89 |
Market/Book |
0.77 |
|
85 |
Beta |
1.55 |
Beta Rank |
24 |
Alpha |
0.20 |
Alpha Rank |
86 |
Want To Know More About Our ValuEngine View Newsletter?
Looking for a monthly portfolio of stock picks which are objective and based on cutting-edge academic theory and Wall St.practice? Then subscribe to The ValuEngine View Newsletter.The ValuEngine View Portfolio is based on our highly-refined and tested ValuEngine Portfolio Strategies along with our proprietary quant-based composite scoring system. The ValuEngine View Newsletter is the product of sophisticated stock valuation and forecast models first developed by Yale Professor of Finance Zhiwu Chen.
VE View vs. S&P 500 Index Past Five Years |
|
VE View |
S&P 500 |
Ann Return |
23.13% |
13.25% |
Ann Volatility |
22.30% |
12.20% |
Sharpe Ratio |
1.04 |
1.09 |
Sortino Ratio |
1.78 |
1.39 |
Max Drawdown |
-34.94% |
-11.14% |
The ValuEngine View Newsletter is derived from the ValuEngine Aggressive and Diversified Growth Benchmark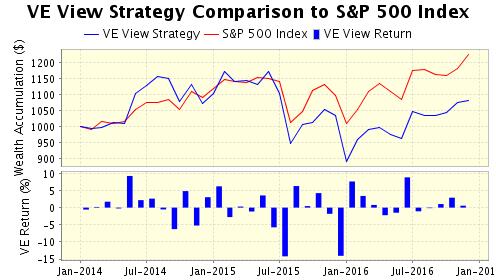 Portfolio Strategies. These strategies are the product of ValuEngine's academic research team and combine cutting-edge financial analysis and portfolio construction techniques with real-world Wall St. know how. Portfolio Strategies. These strategies are the product of ValuEngine's academic research team and combine cutting-edge financial analysis and portfolio construction techniques with real-world Wall St. know how.
CLICK HERE to Subscribe to the ValuEngine View
The ValuEngine View Newsletter portfolio has 15 primary stock picks and five alternates and is re-balanced once each month. The ValuEngine View Newsletter is published near the middle of each calendar month. An equal amount of capital is allocated to each stock. The monthly returns are calculated from the closing prices on date of publication. The performance calculation does not include any transaction costs.
ValuEngine Market Overview
Summary of VE Stock Universe |
Stocks Undervalued |
40.99% |
Stocks Overvalued |
59.01% |
Stocks Undervalued by 20% |
16.18% |
Stocks Overvalued by 20% |
19.39% |
ValuEngine Sector Overview
|
|
|
|
|
|
|
|
0.16% |
-0.47% |
2.87% |
10.46% overvalued |
8.40% |
23.01 |
|
0.43% |
-0.02% |
0.10% |
9.38% overvalued |
8.45% |
17.81 |
|
0.25% |
0.34% |
0.20% |
8.87% overvalued |
13.34% |
22.84 |
|
-0.57% |
-1.09% |
13.42% |
8.68% overvalued |
15.84% |
29.95 |
|
0.20% |
0.18% |
5.07% |
8.48% overvalued |
5.41% |
17.24 |
|
0.10% |
0.09% |
-3.54% |
7.66% overvalued |
-1.46% |
24.22 |
|
0.03% |
-0.50% |
7.90% |
7.42% overvalued |
7.41% |
23.15 |
|
0.03% |
-0.08% |
3.08% |
6.64% overvalued |
6.15% |
30.23 |
|
0.05% |
-0.39% |
-2.78% |
6.28% overvalued |
0.28% |
26.31 |
|
0.14% |
0.29% |
8.89% |
5.34% overvalued |
9.85% |
21.10 |
|
0.08% |
-0.43% |
2.71% |
3.82% overvalued |
7.33% |
25.19 |
|
-0.02% |
-0.88% |
-2.53% |
1.55% overvalued |
-0.52% |
20.87 |
|
0.24% |
-1.10% |
-3.30% |
0.75% undervalued |
0.03% |
16.13 |
|
0.42% |
0.25% |
-1.16% |
1.33% undervalued |
-0.32% |
25.06 |
|
1.16% |
-2.36% |
1.98% |
8.80% undervalued |
-11.93% |
23.29 |
|
-0.84% |
-1.44% |
-5.70% |
12.32% undervalued |
-13.26% |
24.62 |
ValuEngine.com Products and Services
With the ValuEngine Forecast 16 Market Neutral Strategy Portfolio Newsletter, you can run your own portfolio like a hedge fund to manage risk and profit in any market environment. |
|
|
With ValuEngine.com's Premium Website Membership you get forecasts, valuations, and recommendations on more than 7,000 stocks updated every trading day!
NO OBLIGATION, 30-DAY FREE TRIAL! |
|
 |

|