
November 7, 2014
Our Valuation WATCH is OFF: Overvaluation is up a bit but barely out of "normal" range. Overvalued stocks now make up 60.18% of our stocks assigned a valuation and 20.45% of those equities are calculated to be overvalued by 20% or more. Thirteen sectors are calculated to be overvalued--two by double digits.
ValuEngine Index Overview
ValuEngine Market Overview
ValuEngine Sector Overview
ValuEngine Newsletters Latest Results
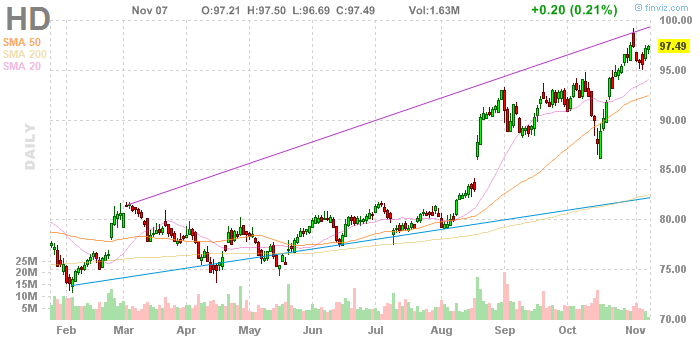
ValuEngine's Newsletters Beat the Market Let ValuEngine Optimize your Portfolio and Provide Rational Advice for Smarter Investing Click HERE to Check Out ValuEngine's Investment Newsletters Free Download for ReadersAs a bonus to our Free Weekly Newsletter subscribers, Home Depot (HD) is the one of world's largest home improvement retailer. The company offers a level of service unprecedented among warehouse-style retailers. Home Depot stores cater to do-it-yourselfers, as well as home improvement, construction and building maintenance professionals. The Home Depot currently operates in the USA, Canada, Chile, Puerto Rico, and Argentina. The company also operates EXPO Design Centers across the U.S. and Villager's Hardware in New Jersey. Despite ongoing bad news over a huge security breach, Home Depot's stock continues to climb. The latest news indicates that the security breach was much larger than originally reported. In addition to 56 million credit card accounts, the company revealed that more than 53 million customer email addresses were also compromised. Email addresses are particularly useful for "phishing" attacks and make unsophisticated internet users more susceptible to identity theft and other crimes.
ValuEngine continues its HOLD recommendation on HOME DEPOT for 2014-11-06. Based on the information we have gathered and our resulting research, we feel that HOME DEPOT has the probability to ROUGHLY MATCH average market performance for the next year. The company exhibits ATTRACTIVE Company Size but UNATTRACTIVE Book Market Ratio. Below is today's data on HD: 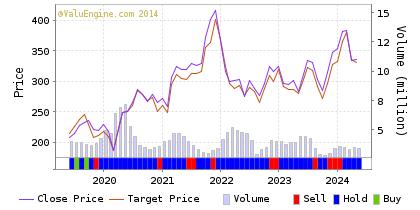
As a bonus to our Newsletter readers, Read our Complete Detailed Valuation Report on HD HERE.
|
||||||||||||||||||||||||||||||||||||||||||||||||||||||||||||||||||||||||||||||||||||||||||||||||||||||||||||||||||||||||||||||||||||||||||||||||||||||||||||||||||||||||||||||||||||||||||||||||||||||||||||||||||||||||||||||||||||||||||||||||||||||||||||||||||||||||||||||||||||||||||||||||||||||||||||||||||||||||||||||||||||||||||||||||||||||||||||||||||||||||||||||||||||||||||||||||||||||||||||||||||||||||||||||||||||||||||||||||||||||||||||||||||||||||||||||||||||||||||||||||||||||||||||||||||||||||||||||||||||||
Ticker |
Name |
Mkt Price |
Valuation(%) |
Last 12-M Retn(%) |
AER |
AERCAP HLDGS NV |
44.58 |
-14.47 |
107.06 |
PJC |
PIPER JAFFRAY |
57.61 |
-5.4 |
64.18 |
CYS |
CYS INVESTMENTS |
8.87 |
-12.56 |
6.1 |
MHLD |
MAIDEN HOLDINGS |
12.61 |
-6.74 |
12.79 |
BFR |
BANCO FRANC-ADR |
13.5 |
N/A |
91.22 |
Top-Five Finance Stocks--Long-Term Forecast Returns
Ticker |
Name |
Mkt Price |
Valuation(%) |
Last 12-M Retn(%) |
AER |
AERCAP HLDGS NV |
44.58 |
-14.47 |
107.06 |
PJC |
PIPER JAFFRAY |
57.61 |
-5.4 |
64.18 |
CYS |
CYS INVESTMENTS |
8.87 |
-12.56 |
6.1 |
MHLD |
MAIDEN HOLDINGS |
12.61 |
-6.74 |
12.79 |
BFR |
BANCO FRANC-ADR |
13.5 |
N/A |
91.22 |
Top-Five Finance Stocks--Composite Score
Ticker |
Name |
Mkt Price |
Valuation(%) |
Last 12-M Retn(%) |
AER |
AERCAP HLDGS NV |
44.58 |
-14.47 |
107.06 |
BX |
BLACKSTONE GRP |
30.3 |
-4.85 |
10.38 |
ITUB |
BANCO ITAU -ADR |
13.84 |
-7.04 |
3.92 |
PJC |
PIPER JAFFRAY |
57.61 |
-5.4 |
64.18 |
DLR |
DIGITAL RLTY TR |
67.61 |
0.6 |
43.09 |
Top-Five Finance Stocks--Most Overvalued
Ticker |
Name |
Mkt Price |
Valuation(%) |
Last 12-M Retn(%) |
FBP |
FIRST BNCRP P R |
5.25 |
300 |
-9.01 |
CPF |
CENTRAL PAC FIN |
19.2 |
300 |
3.67 |
FBC |
FLAGSTAR BANCP |
15.54 |
300 |
-2.88 |
BXMT |
BLACKSTONE MRTG |
27.89 |
105.76 |
11.52 |
AIG |
AMER INTL GRP |
53.91 |
101.94 |
13.28 |
Find out what Wall Street Investment and Media Professionals already know,
ValuEngine offers sophisticated stock valuation and forecast research as well as a variety of portfolio screening and creation tools.
If you are reading this you should sign up for ValuEngine's award-winning stock valuation and forecast service
NO OBLIGATION, 30 DAY FREE TRIAL!To Sign Up for a FREE TRIAL, Please Click HERE

What's Hot
-- VE View Comes Back Strong with Renewed Rally
We still find a positive economic environment for equities within the United States. As we noted a few weeks ago-- when the market was in a sell off mode, most of the doom and gloom seemed to be emanating from political and media sources looking to capitalize on the slight wobble for electoral purposes.
Now, it is worthwhile to note that many of those same "analysts" claim the ongoing rebound is due to the US election results. But we believe that we are seeing not the short-term noise of a mid-term election, but rather the continuation of favorable long-term economic trends within the US that are --finally--being bolstered by an improved employment situation. We hope that nothing from a new GOP-dominated Congress--such as a return to harsh austerity policies favored by the American right wing--will negatively impact the overall upward trajectory of the US economy.
We remind investors once more than mixing politics and investing is a very bad idea. Relying on blatantly political sources for economic analysis and advice is a quick path to a poorly performing portfolio. Whenever you hear an analyst, pundit, or other talking head of any ideological predilection attribute market moves to election results--or the daily ebb and flow of life in Washington DC, it's time to hold on to that wallet/purse.
Consider the market since January 2009--DOW up 94%, SP500 up 118%, NASDAQ up 183%--Anyone who listened to the "BUY GOLD BUY GUNS BUY SEEDS" crowd after the election of 2008 missed out on an epic rally.
In any case, with favorable markets we find that once more our top-performing newsletter portfolio, the ValuEngine View, has bounced back wonderfully and has returned to its winning ways. More than half of our positions are currently at --or close to-- double-digit returns.
Here are the current VE View Newsletter Portfolio Results:
| Ticker | Company Name | Entry Price 10/22/14 | Exit Price | Change | %Change |
AER |
AERCAP HOLDINGS |
40.38 |
44.67 |
4.29 |
10.62 |
AFSI |
AMTRUST FINANCIAL SERVICES |
49.95 |
51.49 |
1.54 |
3.08 |
ATK |
ALLIANT TECHSYSTEMS |
130.06 |
108.86 |
-21.2 |
-16.30 |
AUO |
AU OPTRONICS-ADR |
4 |
4.84 |
0.84 |
21.00 |
BT |
BT GROUP PLC-ADR |
59.92 |
59.42 |
-0.5 |
-0.83 |
GMT |
GATX CORP |
58.32 |
63.68 |
5.36 |
9.19 |
GPRE |
GREEN PLAINS |
31.91 |
34.64 |
2.73 |
8.56 |
HII |
HUNTINGTON INGALLS |
96.84 |
104.96 |
8.12 |
8.38 |
LCI |
LANNETT INC |
44.96 |
53.15 |
8.19 |
18.22 |
LYB |
LYONDELLBASEL-A |
95.19 |
85.25 |
-9.94 |
-10.44 |
MU |
MICRON TECHNOLOGY |
31.19 |
33.71 |
2.52 |
8.08 |
ONNN |
ON SEMICONDUCTOR CORP |
7.79 |
8.21 |
0.42 |
5.39 |
PJC |
PIPER JAFFRAY |
48.78 |
57.62 |
8.84 |
18.12 |
SAFM |
SANDERSON FARMS |
80.89 |
86.27 |
5.38 |
6.65 |
WLK |
WESTLAKE CHEMICAL |
76.79 |
67.33 |
-9.46 |
-12.32 |
| VE VIEW PORTFOLIO | 5.16 |
||||
| GSPC | S&P500 | 1941.28 |
2023.57 |
82.29 |
4.24 |
Want To Know More About Our VE View Newsletter?
The ValuEngine View Newsletter is the product of a sophisticated stock valuation model that was first developed by ValuEngine's academic research team. It utilizes a three factor approach: fundamental variables such as a company's trailing 12-month Earnings-Per-Share (EPS), the analyst consensus estimate of the company's future 12-month EPS, and the 30-year Treasury yield are all used to create a more accurate reflection of a company's fair value. A total of eleven additional firm specific variables are also used. In addition, the portoflio uses top picks from our Forecast Model. In essence, the portfolio is constructed with the best picks from our main propiretary models
Each month you will receive an electronic copy of our newsletter highlighting 15 potential long positions along with five alternate picks. Our investment strategies focus on dozens of fundamental and technical factors for over 8000 individual stocks, synthesize the data, and then come up with a portfolio. Each newsletter portfolio focuses on maximum potential returns so there are no diversity requirements. Each portfolio pick includes critical ValuEngine valuation and forecast data. These 20 total picks represent the most up-to-date equity assessments of our proprietary models.
Please click HERE to subscribe. You may download a sample copy HERE. After your subscription is approved, you will immediately receive access to download the current issue of newsletter as well as the previous issues, which are all available as PDF files. Each month when the latest issue of the newsletter is released, we will send you an email, informing you to download it from the site. The newsletter is released near the middle of each month.
If you no longer wish to receive this free newsletter, CLICK HERE to unsubscribe
