November 11, 2014
Click HERE to Download a FREE Sample of the ValuEngine View NewsletterVALUATION WATCH: Overvalued stocks now make up 61.03% of our stocks assigned a valuation and 21.67% of those equities are calculated to be overvalued by 20% or more. Fourteen sectors are calculated to be overvalued--two by double digits. Copy That--Xerox Lowers Earnings Projections for 2015 Xerox (XRX) is the world's leading enterprise for business process and document management. Its technology, expertise and services enable workplaces - from small businesses to large global enterprises - to simplify the way work gets done so they operate more effectively and focus more on what matters most: their real business. Headquartered in Norwalk, Conn., Xerox offers business process outsourcing and IT outsourcing services, including data processing, healthcare solutions, HR benefits management, finance support, transportation solutions, and customer relationship management services for commercial and government organizations worldwide. The company also provides extensive leading-edge document technology, services, software and genuine Xerox supplies for graphic communication and office printing environments of any size. Today, the company lowered its earnings projections for 2015. Analyst consensus estimates were running at @ $1.18/share but the company has announced lower projections of $1.11-$1.17/share. The Wall Street Journal reports that the company has struggled to broaden its business beyond copiers and printing. Plans to expand into "document management, bill processing and information-technology outsourcing services" entail additional costs while at the same time sales of copiers and printers are slowing. ValuEngine continues its HOLD recommendation on XEROX CORP for 2014-11-10. Based on the information we have gathered and our resulting research, we feel that XEROX CORP has the probability to ROUGHLY MATCH average market performance for the next year. The company exhibits ATTRACTIVE Company Size but UNATTRACTIVE Book Market Ratio. As a bonus to our Newsletter readers, Read our Complete Detailed Valuation Report on Xerox HERE.
Below is today's data on XRX: 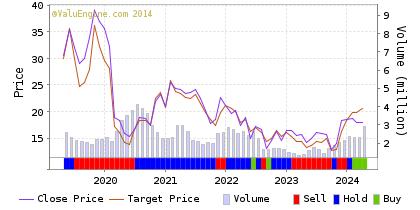
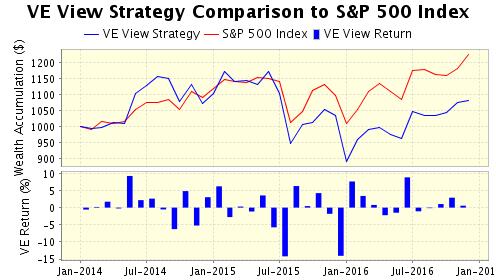
Want To Know More About Our ValuEngine View Newsletter? We still find a positive economic environment for equities within the United States. As we noted a few weeks ago-- when the market was in a sell off mode, most of the doom and gloom seemed to be emanating from political and media sources looking to capitalize on the slight wobble for electoral purposes. Now, it is worthwhile to note that many of those same "analysts" claim the ongoing rebound is due to the US election results. But we believe that we are seeing not the short-term noise of a mid-term election, but rather the continuation of favorable long-term economic trends within the US that are --finally--being bolstered by an improved employment situation. We hope that nothing from a new GOP-dominated Congress--such as a return to harsh austerity policies favored by the American right wing--will negatively impact the overall upward trajectory of the US economy. We remind investors once more than mixing politics and investing is a very bad idea. Relying on blatantly political sources for economic analysis and advice is a quick path to a poorly performing portfolio. Whenever you hear an analyst, pundit, or other talking head of any ideological predilection attribute market moves to election results--or the daily ebb and flow of life in Washington DC, it's time to hold on to that wallet/purse. Consider the market since January 2009--DOW up 94%, SP500 up 118%, NASDAQ up 183%--Anyone who listened to the "BUY GOLD BUY GUNS BUY SEEDS" crowd after the election of 2008 missed out on an epic rally. In any case, with favorable markets we find that once more our top-performing newsletter portfolio, the ValuEngine View, has bounced back wonderfully and has returned to its winning ways. More than half of our positions are currently at --or close to-- double-digit returns. Looking for a monthly portfolio of stock picks which are objective and based on cutting-edge academic theory and Wall St.practice? Then subscribe to The ValuEngine View Newsletter.The ValuEngine View Portfolio is based on our highly-refined and tested ValuEngine Portfolio Strategies along with our proprietary quant-based composite scoring system. The ValuEngine View Newsletter is the product of sophisticated stock valuation and forecast models first developed by Yale Professor of Finance Zhiwu Chen. Here are the current VE View Newsletter Portfolio Results (Thursday's Close):
The ValuEngine View Newsletter is the product of a sophisticated stock valuation model that was first developed by ValuEngine's academic research team. It utilizes a three factor approach: fundamental variables such as a company's trailing 12-month Earnings-Per-Share (EPS), the analyst consensus estimate of the company's future 12-month EPS, and the 30-year Treasury yield are all used to create a more accurate reflection of a company's fair value. A total of eleven additional firm specific variables are also used. In addition, the portoflio uses top picks from our Forecast Model. In essence, the portfolio is constructed with the best picks from our main propiretary models Each month you will receive an electronic copy of our newsletter highlighting 15 potential long positions along with five alternate picks. Our investment strategies focus on dozens of fundamental and technical factors for over 8000 individual stocks, synthesize the data, and then come up with a portfolio. Each newsletter portfolio focuses on maximum potential returns so there are no diversity requirements. Each portfolio pick includes critical ValuEngine valuation and forecast data. These 20 total picks represent the most up-to-date equity assessments of our proprietary models. Please click HERE to subscribe. You may download a sample copy HERE. After your subscription is approved, you will immediately receive access to download the current issue of newsletter as well as the previous issues, which are all available as PDF files. Each month when the latest issue of the newsletter is released, we will send you an email, informing you to download it from the site. The newsletter is released near the middle of each month.
The ValuEngine View Newsletter is derived from the ValuEngine Aggressive and Diversified Growth Benchmark CLICK HERE to Subscribe to the ValuEngine View The ValuEngine View Newsletter portfolio has 15 primary stock picks and five alternates and is re-balanced once each month. The ValuEngine View Newsletter is published near the middle of each calendar month. An equal amount of capital is allocated to each stock. The monthly returns are calculated from the closing prices on date of publication. The performance calculation does not include any transaction costs.
ValuEngine Market Overview
ValuEngine Sector Overview
ValuEngine.com Products and Services
|
||||||||||||||||||||||||||||||||||||||||||||||||||||||||||||||||||||||||||||||||||||||||||||||||||||||||||||||||||||||||||||||||||||||||||||||||||||||||||||||||||||||||||||||||||||||||||||||||||||||||||||||||||||||||||||||||||||||||||||||||||||||||||||||||||||||||||||||||||||||||||||||||||||||||||||||||||||||||||||||||||||||||||||||||||||||||||||||||||||