
November 14, 2014
Valuation WATCH: Overvalued stocks now make up 61.28% of our stocks assigned a valuation and 21.7% of those equities are calculated to be overvalued by 20% or more. Fourteen sectors are calculated to be overvalued--five by double digits.
ValuEngine Index Overview
ValuEngine Market Overview
ValuEngine Sector Overview
ValuEngine Newsletters Latest Results
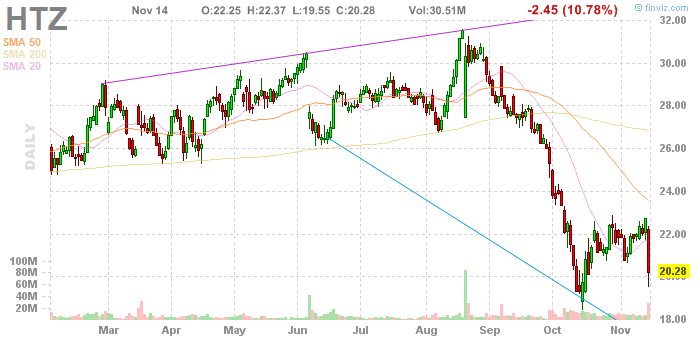
ValuEngine's Newsletters Beat the Market Let ValuEngine Optimize your Portfolio and Provide Rational Advice for Smarter Investing Click HERE to Check Out ValuEngine's Investment Newsletters Free Download for ReadersAs a bonus to our Free Weekly Newsletter subscribers, HERTZ GLOBAL HOLDINGS (HTZ) is the worlds largest general use car rental brand, operating from approximately 8,100 locations in 147 countries worldwide. Hertz is the number one airport car rental brand in the U.S. and at 69 major airports in Europe, operating both corporate and licensee locations in cities and airports in North America,
ValuEngine continues its HOLD recommendation on HERTZ GLOBAL HOLDINGS for 2014-11-13. Based on the information we have gathered and our resulting research, we feel that HERTZ GLOBAL HOLDINGS has the probability to ROUGHLY MATCH average market performance for the next year. The company exhibits ATTRACTIVE Company Size but UNATTRACTIVE Book Market Ratio. Below is today's data on HTZ: 
As a bonus to our Newsletter readers, Read our Complete Detailed Valuation Report on HTZ HERE.
|
||||||||||||||||||||||||||||||||||||||||||||||||||||||||||||||||||||||||||||||||||||||||||||||||||||||||||||||||||||||||||||||||||||||||||||||||||||||||||||||||||||||||||||||||||||||||||||||||||||||||||||||||||||||||||||||||||||||||||||||||||||||||||||||||||||||||||||||||||||||||||||||||||||||||||||||||||||||||||||||||||||||||||||||||||||||||||||||||||||||||||||||||||||||||||||||||||||||||||||||||||||||||||||||||||||||||||||||||||||||||||||||||||||||||||||||||||||||||||||||||||||||||||||||||||||||||||||||||||||||
Ticker |
Name |
Mkt Price |
Valuation(%) |
Last 12-M Retn(%) |
HLF |
HERBALIFE LTD |
37.85 |
-39.68 |
-41.44 |
IM |
INGRAM MICRO |
26.75 |
-2.52 |
11.46 |
LAD |
LITHIA MOTORS |
75.62 |
-6.82 |
15.56 |
CONN |
CONNS INC |
31.68 |
-37.41 |
-48.89 |
ANF |
ABERCROMBIE |
28.9 |
-33.59 |
-17.97 |
Top-Five Retail/Wholesale Stocks--Long-Term Forecast Returns
Ticker |
Name |
Mkt Price |
Valuation(%) |
Last 12-M Retn(%) |
HLF |
HERBALIFE LTD |
37.85 |
-39.68 |
-41.44 |
IM |
INGRAM MICRO |
26.75 |
-2.52 |
11.46 |
LAD |
LITHIA MOTORS |
75.62 |
-6.82 |
15.56 |
CONN |
CONNS INC |
31.68 |
-37.41 |
-48.89 |
ANF |
ABERCROMBIE |
28.9 |
-33.59 |
-17.97 |
Top-Five Retail/Wholesale Stocks--Composite Score
Ticker |
Name |
Mkt Price |
Valuation(%) |
Last 12-M Retn(%) |
IM |
INGRAM MICRO |
26.75 |
-2.52 |
11.46 |
LAD |
LITHIA MOTORS |
75.62 |
-6.82 |
15.56 |
HLF |
HERBALIFE LTD |
37.85 |
-39.68 |
-41.44 |
PAG |
PENSKE AUTO GRP |
47.73 |
-0.05 |
13.53 |
M |
MACYS INC |
61.57 |
7.78 |
21.49 |
Top-Five Retail/Wholesale Stocks--Most Overvalued
Ticker |
Name |
Mkt Price |
Valuation(%) |
Last 12-M Retn(%) |
HGG |
HHGREGG INC |
6.16 |
138.73 |
-62.89 |
DENN |
DENNY'S CORP |
8.86 |
75.62 |
29.72 |
TUES |
TUESDAY MORNING |
21.15 |
65.3 |
69.95 |
NLS |
NAUTILUS INC |
14.28 |
59.94 |
90.91 |
BBW |
BUILD-A-BEAR WK |
18.29 |
56 |
87.78 |
Find out what Wall Street Investment and Media Professionals already know,
ValuEngine offers sophisticated stock valuation and forecast research as well as a variety of portfolio screening and creation tools.
If you are reading this you should sign up for ValuEngine's award-winning stock valuation and forecast service
NO OBLIGATION, 30 DAY FREE TRIAL!To Sign Up for a FREE TRIAL, Please Click HERE

What's Hot--
With Latest Market Rebound, Overvaluation Creeps Up
ValuEngine tracks more than 7000 US equities, ADRs, and foreign stock which trade on US exchanges as well as @1000 Canadian equities. When EPS estimates are available for a given equity, our model calculates a level of mispricing or valuation percentage for that equity based on earnings estimates and what the stock should be worth if the market were totally rational and efficient--an academic exercise to be sure, but one which allows for useful comparisons between equities, sectors, and industries. Using our Valuation Model, we can currently assign a VE valuation calculation to more than 2900 stocks in our US Universe.
We combine all of the equities with a valuation calculation to track market valuation figures and use them as a metric for making calls about the overall state of the market. Two factors can lower these figures-- a market pullback, or a significant rise in EPS estimates. Vice-versa, a significant rally or reduction in EPS can raise the figure. Whenever we see overvaluation levels in excess of @ 65% for the overall universe and/or 27% for the overvalued by 20% or more categories, we issue a valuation warning.
We now calculate that 62.26% of stocks are overvalued and 22.66% of those stocks are overvalued by 20% or more. These figures are up significantly from where they were at back in mid-October. Overvalaution declined below the threshold for a warning back on September 23rd, continued to decline, and bottomed out at @40% overvalued on October 14th. Since then, the market has rebounded admirably, and we blew right through "normal" range.
With these sorts of numbers, we now operate under a "Valuation Watch." If the figures continue to increase, we could issue another Valuation Warning within a few days. We have seen the high levels currently associated with the market rally since May, 2013. And it is looking like the recent downturn was little more than an Isis/Ebola/US mid-term election-driven panic sell off rather than an indicator of a fundamental issue with US equities or the economy.
In any case, we now have a Valuation Watch. But, we would expect that this will only be a temporary respite and that overvaluation will soon exceed the 65% level required for a Valuation Warning if/when the market lays in its next move to the upside.
Subscribers Get FULL ACCESS to our Market and Sector Overviews
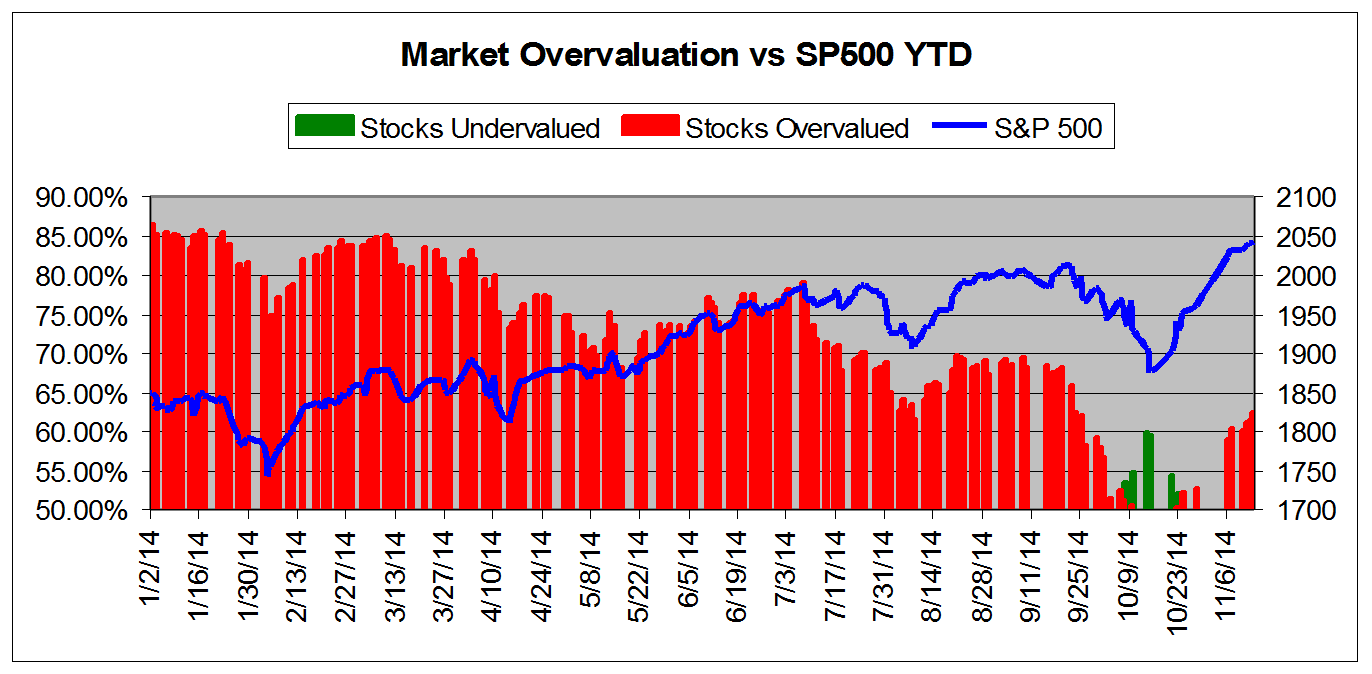
The chart below tracks the valuation metrics from January 2014. It shows levels in excess of 50%.
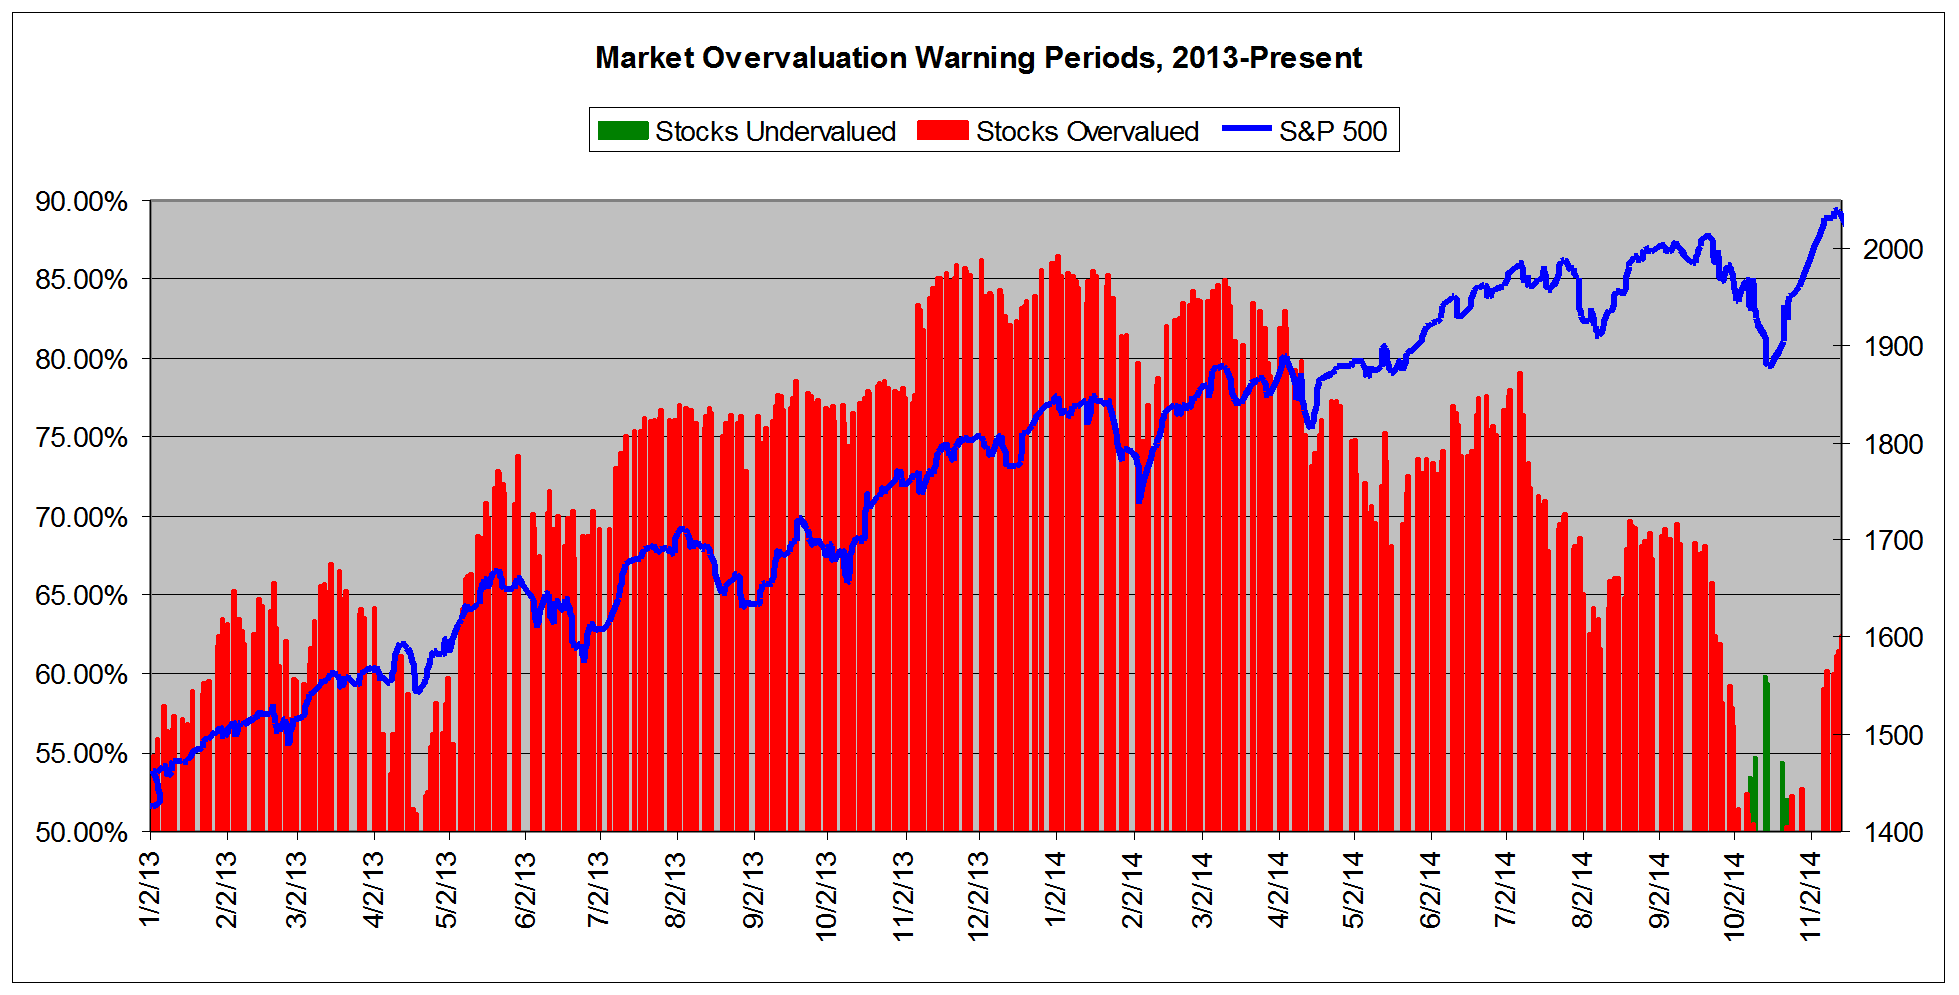
This chart shows overall universe over valuation in excess of 50% vs the S&P 500 from January 2013
This chart shows overall universe under and over valuation in excess of 50% vs the S&P 500 from March 2007*
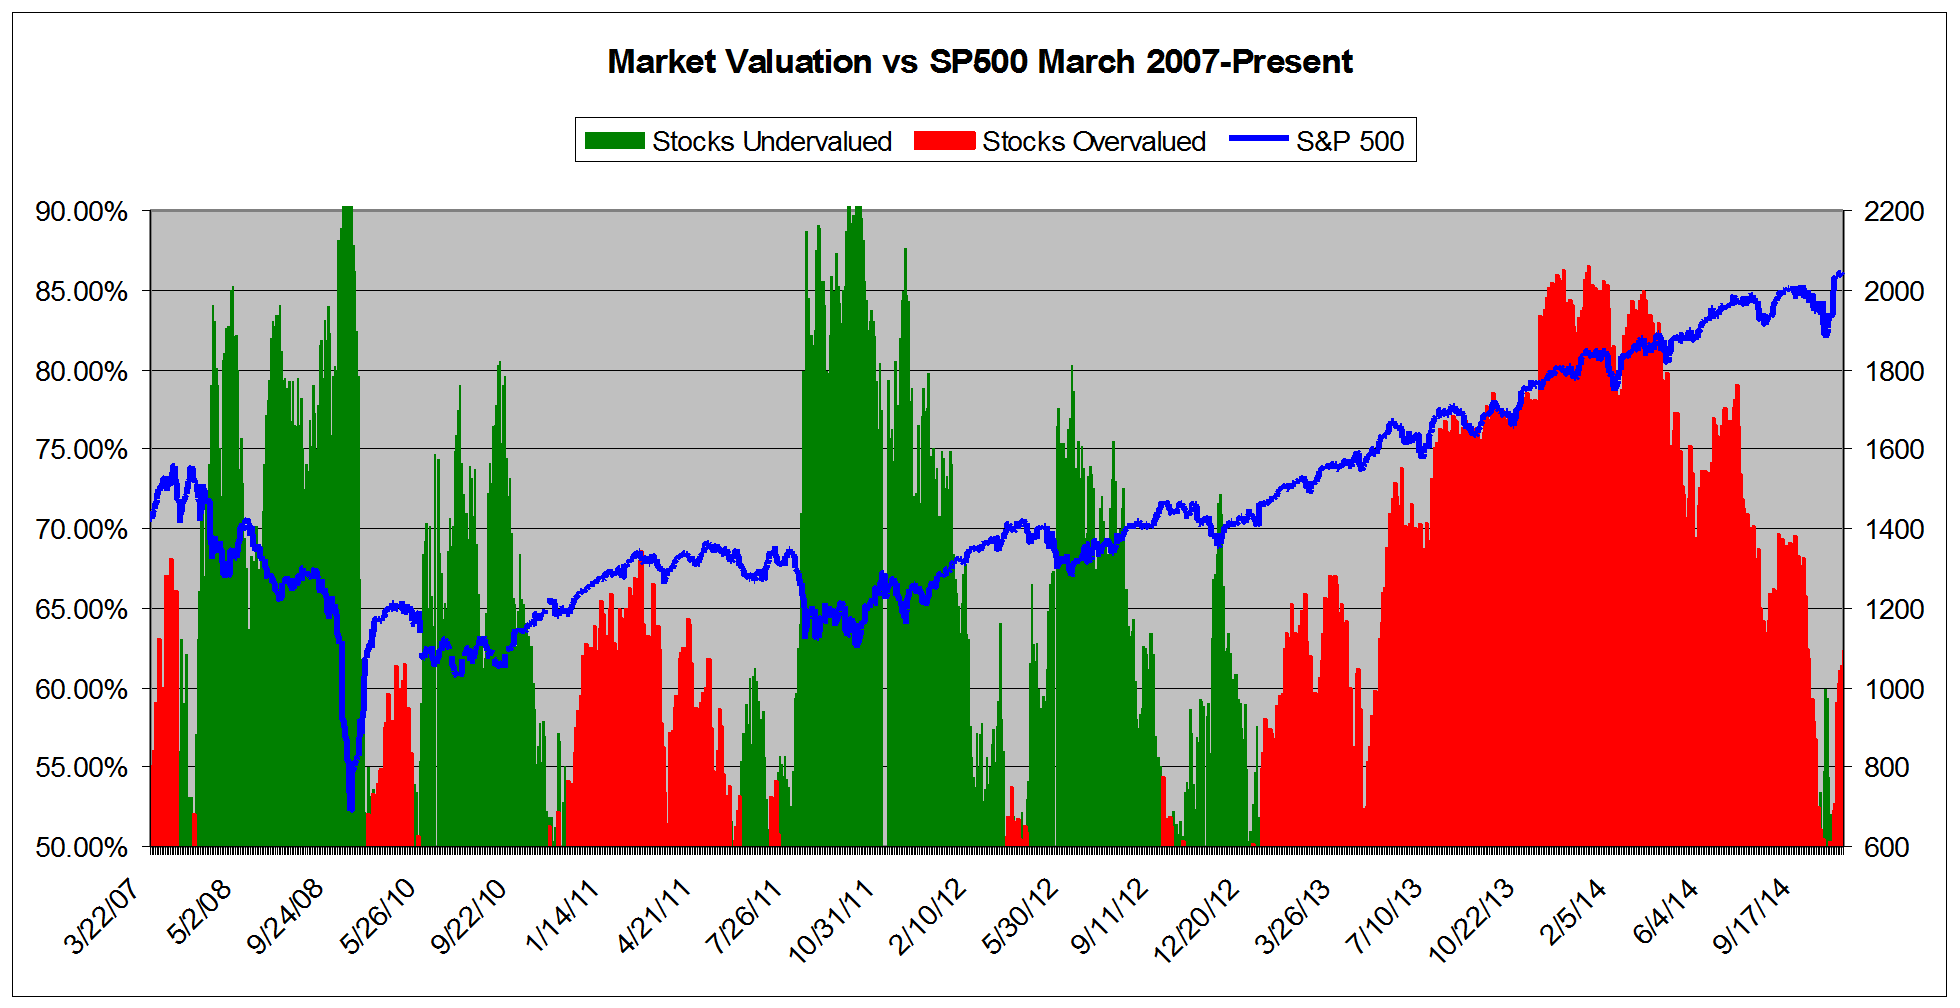
*NOTE: Time Scale Compressed Prior to 2011.
In addition to the overall valuation metrics, we see that on a sector basis overvaluation has also increased. Fourteen of sixteen sectors are now overvalued according to our Valuation Model, with four of them calculated to be overvalued by double digits--and four more sitting in the 9% overvalued range.
-- VE View Comes Back Strong with Renewed Rally
We still find a positive economic environment for equities within the United States. As we noted a few weeks ago-- when the market was in a sell off mode, most of the doom and gloom seemed to be emanating from political and media sources looking to capitalize on the slight wobble for electoral purposes.
Now, it is worthwhile to note that many of those same "analysts" claim the ongoing rebound is due to the US election results. But we believe that we are seeing not the short-term noise of a mid-term election, but rather the continuation of favorable long-term economic trends within the US that are --finally--being bolstered by an improved employment situation. We hope that nothing from a new GOP-dominated Congress--such as a return to harsh austerity policies favored by the American right wing--will negatively impact the overall upward trajectory of the US economy.
We remind investors once more than mixing politics and investing is a very bad idea. Relying on blatantly political sources for economic analysis and advice is a quick path to a poorly performing portfolio. Whenever you hear an analyst, pundit, or other talking head of any ideological predilection attribute market moves to election results--or the daily ebb and flow of life in Washington DC, it's time to hold on to that wallet/purse.
Consider the market since January 2009--DOW up 105%, SP500 up 129%, NASDAQ up 196%--Anyone who listened to the "BUY GOLD BUY GUNS BUY SEEDS" crowd after the election of 2008 missed out on an epic rally.
In any case, with favorable markets we find that once more our top-performing newsletter portfolio, the ValuEngine View, has bounced back wonderfully and has returned to its winning ways.
Here are the current VE View Newsletter Portfolio Results:
| Ticker | Company Name | Entry Price 10/22/14 | Last Price | Change | %Change |
AER |
AERCAP HOLDINGS |
40.38 |
43.38 |
3.00 |
7.43 |
AFSI |
AMTRUST FINANCIAL SERVICES |
49.95 |
52.16 |
2.21 |
4.42 |
ATK |
ALLIANT TECHSYSTEMS |
130.06 |
111.14 |
-18.92 |
-14.55 |
AUO |
AU OPTRONICS-ADR |
4 |
4.54 |
0.54 |
13.50 |
BT |
BT GROUP PLC-ADR |
59.92 |
58.31 |
-1.61 |
-2.69 |
GMT |
GATX CORP |
58.32 |
65.24 |
6.92 |
11.87 |
GPRE |
GREEN PLAINS |
31.91 |
33.01 |
1.10 |
3.45 |
HII |
HUNTINGTON INGALLS |
96.84 |
107.83 |
10.99 |
11.35 |
LCI |
LANNETT INC |
44.96 |
48.28 |
3.32 |
7.38 |
LYB |
LYONDELLBASEL-A |
95.19 |
87.94 |
-7.25 |
-7.62 |
MU |
MICRON TECHNOLOGY |
31.19 |
32.94 |
1.75 |
5.61 |
ONNN |
ON SEMICONDUCTOR CORP |
7.79 |
8.19 |
0.40 |
5.13 |
PJC |
PIPER JAFFRAY |
48.78 |
57.57 |
8.79 |
18.02 |
SAFM |
SANDERSON FARMS |
80.89 |
85.61 |
4.72 |
5.84 |
WLK |
WESTLAKE CHEMICAL |
76.79 |
66.72 |
-10.07 |
-13.11 |
| VE VIEW PORTFOLIO | 3.74 |
||||
| GSPC | S&P500 | 1941.28 |
2039.33 |
98.05 |
5.05 |
Want To Know More About Our VE View Newsletter?
The ValuEngine View Newsletter is the product of a sophisticated stock valuation model that was first developed by ValuEngine's academic research team. It utilizes a three factor approach: fundamental variables such as a company's trailing 12-month Earnings-Per-Share (EPS), the analyst consensus estimate of the company's future 12-month EPS, and the 30-year Treasury yield are all used to create a more accurate reflection of a company's fair value. A total of eleven additional firm specific variables are also used. In addition, the portoflio uses top picks from our Forecast Model. In essence, the portfolio is constructed with the best picks from our main propiretary models
Each month you will receive an electronic copy of our newsletter highlighting 15 potential long positions along with five alternate picks. Our investment strategies focus on dozens of fundamental and technical factors for over 8000 individual stocks, synthesize the data, and then come up with a portfolio. Each newsletter portfolio focuses on maximum potential returns so there are no diversity requirements. Each portfolio pick includes critical ValuEngine valuation and forecast data. These 20 total picks represent the most up-to-date equity assessments of our proprietary models.
Please click HERE to subscribe. You may download a sample copy HERE. After your subscription is approved, you will immediately receive access to download the current issue of newsletter as well as the previous issues, which are all available as PDF files. Each month when the latest issue of the newsletter is released, we will send you an email, informing you to download it from the site. The newsletter is released near the middle of each month.
If you no longer wish to receive this free newsletter, CLICK HERE to unsubscribe
