
January 16, 2015
Valuation Watch: Overvalued stocks now make up 40.44% of our stocks assigned a valuation and 11.91% of those equities are calculated to be overvalued by 20% or more. Eight sectors are calculated to be overvalued--with two at or near double digits. ValuEngine Index Overview
ValuEngine Market Overview
ValuEngine Sector Overview
ValuEngine Newsletters Latest Results
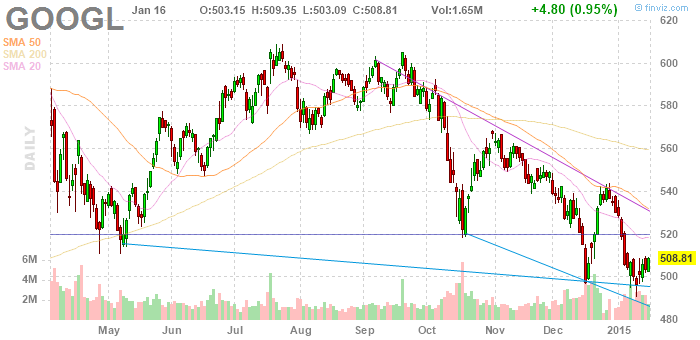
*NOTE: Benchmark for Forecast MNS for last month and inception is the MLSAX Long/Short Fund. Benchmark for Small Cap for last month and inception is the Russell 2000 Small Cap Index (RUT). Benchmark for current month Forecast MNS and all other portfolios for all timeframes is the S&P500. ValuEngine's Newsletters Beat the Market Let ValuEngine Optimize your Portfolio and Provide Rational Advice for Smarter Investing Click HERE to Check Out ValuEngine's Investment Newsletters Free Download for ReadersAs a bonus to our Free Weekly Newsletter subscribers, Google Inc. (GOOGL) is a technology company that provides a web based search engine through its website. The Company offers a wide range of search options, including web, image, groups, directory, and news searches. It serves corporate clients, including advertisers, content publishers and site managers with cost-effective advertising and a wide range of revenue generating search services. Google Inc. is headquartered in Mountain View, California. ValuEngine continues its HOLD recommendation on GOOGLE INC-CL A for 2015-01-15. Based on the information we have gathered and our resulting research, we feel that GOOGLE INC-CL A has the probability to ROUGHLY MATCH average market performance for the next year. The company exhibits ATTRACTIVE Company Size but UNATTRACTIVE Price Sales Ratio. Below is today's data on Google: 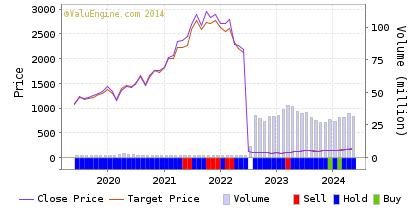
As a bonus to our Newsletter readers, Read our Complete Detailed Valuation Report on Google HERE.
|
|||||||||||||||||||||||||||||||||||||||||||||||||||||||||||||||||||||||||||||||||||||||||||||||||||||||||||||||||||||||||||||||||||||||||||||||||||||||||||||||||||||||||||||||||||||||||||||||||||||||||||||||||||||||||||||||||||||||||||||||||||||||||||||||||||||||||||||||||||||||||||||||||||||||||||||||||||||||||||||||||||||||||||||||||||||||||||||||||||||||||||||||||||||||||||||||||||||||||||||||||||||||||||||||||||||||||||||||
Ticker |
Name |
Mkt Price |
Valuation(%) |
Last 12-M Retn(%) |
| GPRE | GREEN PLAINS | 20.5 | -43.02 | 2.86 |
| SBGL | SIBANYE GLD-ADR | 10.05 | N/A | 93.64 |
| NSU | NEVSUN RESOURCS | 3.5 | -22.11 | -5.91 |
| HCLP | HI-CRUSH PTNRS | 33.26 | N/A | -3.03 |
| RIC | RICHMONT MINES | 3.37 | N/A | 163.28 |
Top-Five Basic Materials Stocks--Long-Term Forecast Returns
Ticker |
Name |
Mkt Price |
Valuation(%) |
Last 12-M Retn(%) |
| GPRE | GREEN PLAINS | 20.5 | -43.02 | 2.86 |
| SBGL | SIBANYE GLD-ADR | 10.05 | N/A | 93.64 |
| NSU | NEVSUN RESOURCS | 3.5 | -22.11 | -5.91 |
| HCLP | HI-CRUSH PTNRS | 33.26 | N/A | -3.03 |
| RIC | RICHMONT MINES | 3.37 | N/A | 163.28 |
Top-Five Basic Materials Stocks--Composite Score
Ticker |
Name |
Mkt Price |
Valuation(%) |
Last 12-M Retn(%) |
| GPRE | GREEN PLAINS | 20.5 | -43.02 | 2.86 |
| LYB | LYONDELLBASEL-A | 75.27 | -24.99 | -9.04 |
| AA | ALCOA INC | 14.97 | -8.61 | 41.36 |
| CE | CELANESE CP-A | 55.69 | -15.96 | -0.16 |
| WLK | WESTLAKE CHEM | 55.2 | -27.47 | -11.07 |
Top-Five Basic Materials Stocks--Most Overvalued
Ticker |
Name |
Mkt Price |
Valuation(%) |
Last 12-M Retn(%) |
| IAG | IAMGOLD CORP | 3.01 | 300 | -21 |
| BVN | BUENAVENTUR-ADR | 10.91 | 48.7 | -9.01 |
| CF | CF INDUS HLDGS | 288.74 | 45.71 | 16.23 |
| IPHS | INNOPHOS HLDGS | 59.59 | 35.15 | 20.26 |
| SIAL | SIGMA ALDRICH | 137 | 33.55 | 47.34 |
Find out what Wall Street Investment and Media Professionals already know,
ValuEngine offers sophisticated stock valuation and forecast research as well as a variety of portfolio screening and creation tools.
If you are reading this you should sign up for ValuEngine's award-winning stock valuation and forecast service
NO OBLIGATION, 30 DAY FREE TRIAL!To Sign Up for a FREE TRIAL, Please Click HERE

Want To Know More About Our ValuEngine View Newsletter?
Looking for a monthly portfolio of stock picks which are objective and based on cutting-edge academic theory and Wall St.practice? Then subscribe to The ValuEngine View Newsletter.The ValuEngine View Portfolio is based on our highly-refined and tested ValuEngine Portfolio Strategies along with our proprietary quant-based composite scoring system. The ValuEngine View Newsletter is the product of sophisticated stock valuation and forecast models first developed by Yale Professor of Finance Zhiwu Chen.
The ValuEngine View Newsletter is the product of a sophisticated stock valuation model that was first developed by ValuEngine's academic research team. It utilizes a three factor approach: fundamental variables such as a company's trailing 12-month Earnings-Per-Share (EPS), the analyst consensus estimate of the company's future 12-month EPS, and the 30-year Treasury yield are all used to create a more accurate reflection of a company's fair value. A total of eleven additional firm specific variables are also used. In addition, the portoflio uses top picks from our Forecast Model. In essence, the portfolio is constructed with the best picks from our main propiretary models
Each month you will receive an electronic copy of our newsletter highlighting 15 potential long positions along with five alternate picks. Our investment strategies focus on dozens of fundamental and technical factors for over 8000 individual stocks, synthesize the data, and then come up with a portfolio. Each newsletter portfolio focuses on maximum potential returns so there are no diversity requirements. Each portfolio pick includes critical ValuEngine valuation and forecast data. These 20 total picks represent the most up-to-date equity assessments of our proprietary models.
Please click HERE to subscribe. You may download a sample copy HERE. After your subscription is approved, you will immediately receive access to download the current issue of newsletter as well as the previous issues, which are all available as PDF files. Each month when the latest issue of the newsletter is released, we will send you an email, informing you to download it from the site. The newsletter is released near the middle of each month.
VE View vs. S&P 500 Index Past Five Years |
||
VE View |
S&P 500 |
|
|---|---|---|
Ann Return |
24.78% | 14.56% |
Ann Volatility |
22.28% | 12.35% |
Sharpe Ratio |
1.11 | 1.18 |
Sortino Ratio |
1.88 | 1.53 |
Max Drawdown |
-34.94% | -11.14% |
The ValuEngine View Newsletter is derived from the ValuEngine Aggressive and Diversified Growth Benchmark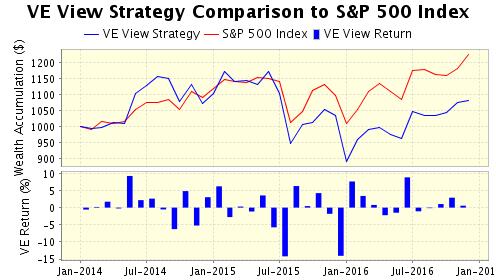 Portfolio Strategies. These strategies are the product of ValuEngine's academic research team and combine cutting-edge financial analysis and portfolio construction techniques with real-world Wall St. know how.
CLICK HERE to Subscribe to the ValuEngine View
The ValuEngine View Newsletter portfolio has 15 primary stock picks and five alternates and is re-balanced once each month. The ValuEngine View Newsletter is published near the middle of each calendar month. An equal amount of capital is allocated to each stock. The monthly returns are calculated from the closing prices on date of publication. The performance calculation does not include any transaction costs.
If you no longer wish to receive this free newsletter, CLICK HERE to unsubscribe
