February 25, 2014
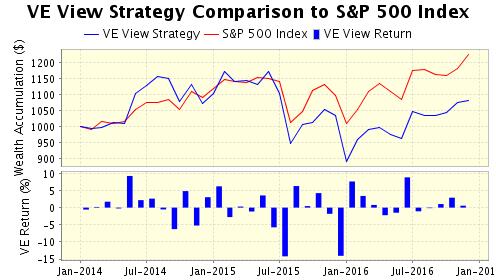
Click HERE to Download a FREE Sample of the ValuEngine View NewsletterValuation WATCH: Overvalued stocks now make up 58.91% of our stocks assigned a valuation and 20.02% of those equities are calculated to be overvalued by 20% or more. Twelve sectors are calculated to be overvalued--with six sectors at or near double digits. ValuEngine View Joins Party--Top VE Newsletter Posts Another SP500 Beat For January/February, the stock market continued its winning ways and laid in some new highs. Our ValuEngine View Responded well to the market condtiions and we returned to our winning ways with a significant gain of 6.2%. We beat the S&P 500 index gain of 2.54% by 366 bps. The trailing 12 month gain of the VE View is 18.03% versus the S&P 500 return of 15.68%. The return since inception of the View is 133.45% versus the S&P's gain of 86.8. For the second month in-a-row we had a 66% hit-ratio with declines being modest. Our biggest decline was just 7.22%. Gains were better this month, with five positions near, or well into double-digits. Lannett led the way with a huge 42% gain while Lennar, Greenbrier, Lear, and United Rentals powered up our results. Once again our suggested stop-loss levels of 15% had no effect given the few losers and the limited nature of their declines. Currently, the Valuation Model finds that 58.91% of the equities to which we can assign a valuation are overvalued--with 20.02% coming in overvalued at 20% or more. Twelve sectors are overvalued— with six of them at or near double-digits. We have seen a pretty big shift in overvaluation over the past month. The latest news from Janet Yellen's Fed remains positive for US equities in the short term. Adjustments have been made to oil at @$50/barrel and the US is in an enviable position vis-a-vis energy right now. Employment is picking up steam—witness the latest announced wage increases from Wal-Mart, who is dealing with pressure from within and without when it comes to compensation. Let's just hope Congress doesn't screw up this momentum with ill-advised austerity moves or shut downs (partial or not.)
The View features the absolute top quality picks from our extensively tracked and tested quant models. It is the only newsletter which features picks from both the ValuEngine Stock Valuation and Forecast Model. With the View, investors can utilize the power of ValuEngine to achieve their goals in a steady and consistent manner.
With the ValuEngine View Newsletter you Receive 20 Carefully Selected Stock Picks
Here are the latest results from January/February 2015:
Our Investment Strategies Focus on Dozens of Fundamental and Technical Factors for over 7,000 Individual Stocks, Synthesize the Data, and then Come Up with a Portfolio Looking for a monthly portfolio of stock picks which are objective and based on cutting-edge academic theory and Wall St.practice? Then subscribe to The ValuEngine View Newsletter.The ValuEngine View Portfolio is based on our highly-refined and tested ValuEngine Portfolio Strategies along with our proprietary quant-based composite scoring system. The ValuEngine View Newsletter is the product of sophisticated stock valuation and forecast models first developed by Yale Professor of Finance Zhiwu Chen.
The ValuEngine View Newsletter is derived from the ValuEngine Aggressive and Diversified Growth Benchmark CLICK HERE to Subscribe to the ValuEngine View The ValuEngine View Newsletter portfolio has 15 primary stock picks and five alternates and is re-balanced once each month. The ValuEngine View Newsletter is published near the middle of each calendar month. An equal amount of capital is allocated to each stock. The monthly returns are calculated from the closing prices on date of publication. The performance calculation does not include any transaction costs. ValuEngine Market Overview
ValuEngine Sector Overview
ValuEngine.com Products and Services
|
|||||||||||||||||||||||||||||||||||||||||||||||||||||||||||||||||||||||||||||||||||||||||||||||||||||||||||||||||||||||||||||||||||||||||||||||||||||||||||||||||||||||||||||||||||||||||||||||||||||||||||||||||||||||||||||||||||||||||||||||||||||||||||||||||||||||||||||||||||||


