June 18, 2015
ATTENTION
Advanced Investors and Finance Professionals:
If you are reading this you should download ValuEngine
Institutional Software to see how VEs powerful quantitative
tools can increase your productivity and effectiveness. |
VALUATION WATCH: Overvalued stocks now make up 63.55% of our stocks assigned a valuation and 26.77% of those equities are calculated to be overvalued by 20% or more. ALL sectors are calculated to be overvalued--with eight at or near double digits.
--High Tech
NASDAQ Jumps to New Intraday High
Markets have jumped hard today on a variety of good news for equities. The NASDAQ has reached a level not seen since the dotcom boom of 2000 and both the S&P 500 and the Dow have also jumped up in early trading today.
Investors have reacted positively to the latest news from the Fed that the economy is firming up and while it is looking like rates are going up, the central bank is not quite ready to boost them just yet and may let the economy run a bit more before easing off the throttle.
Highlights from the Fed's latest FOMC meeting included the following:
Economic activity has been expanding moderately after having changed little during the first quarter. The pace of job gains picked up while the unemployment rate remained steady.
Market-based measures of inflation compensation remain low; survey-based measures of longer-term inflation expectations have remained stable.
The Committee expects that, with appropriate policy accommodation, economic activity will expand at a moderate pace, with labor market indicators continuing to move toward levels the Committee judges consistent with its dual mandate.
Inflation is anticipated to remain near its recent low level in the near term, but the Committee expects inflation to rise gradually toward 2 percent over the medium term as the labor market improves further and the transitory effects of earlier declines in energy and import prices dissipate.
The Committee today reaffirmed its view that the current 0 to 1/4 percent target range for the federal funds rate remains appropriate. In determining how long to maintain this target range, the Committee will assess progress--both realized and expected--toward its objectives of maximum employment and 2 percent inflation
The Committee anticipates that it will be appropriate to raise the target range for the federal funds rate when it has seen further improvement in the labor market and is reasonably confident that inflation will move back to its 2 percent objective over the medium term.
The Committee currently anticipates that, even after employment and inflation are near mandate-consistent levels, economic conditions may, for some time, warrant keeping the target federal funds rate below levels the Committee views as normal in the longer run. (emphasis added)
We thus see a Fed that is properly balancing inflation concerns with efforts to promote full employment. While it is often tough to read the tea leaves, here we have a clear restatement of the Fed's dual mandate (manage inflation and promote employment) and a clear indication that they are prepared to keep rates low until they are sure the labor market has properly recovered. Thus it appears as though equities will remain the only game in town for a while longer.
Below, we present the top-twenty stocks that trade on the NASDAQ 100. They were selected according to their one-year forecast figures. Members can always screen for these stocks using our advanced screening page HERE.
Ticker |
Company Name |
Market Price |
Valuation |
Last 12-M Retrn |
1-M Forecast Retn |
1-Yr Forecast Retn |
P/E Ratio |
Sector Name |
AAL |
AMER AIRLINES |
39.88 |
-8.93% |
-0.70% |
1.13% |
13.60% |
5.40 |
Transportation |
AAPL |
APPLE INC |
127.3 |
12.77% |
40.77% |
0.88% |
10.57% |
15.14 |
Computer and Technology |
AMGN |
AMGEN INC |
155.65 |
8.43% |
34.19% |
0.70% |
8.38% |
16.66 |
Medical |
AVGO |
AVAGO TECHNOLOG |
140.685 |
11.85% |
99.07% |
0.47% |
5.61% |
19.64 |
Computer and Technology |
BBBY |
BED BATH&BEYOND |
70.07 |
-1.86% |
15.15% |
0.95% |
11.34% |
13.74 |
Retail-Wholesale |
BRCM |
BROADCOM CORP-A |
53.75 |
7.00% |
68.65% |
0.56% |
6.70% |
19.24 |
Computer and Technology |
CA |
CA INC |
30.29 |
8.69% |
5.58% |
0.74% |
8.89% |
12.59 |
Computer and Technology |
CSCO |
CISCO SYSTEMS |
28.93 |
9.46% |
17.51% |
0.73% |
8.74% |
14.74 |
Computer and Technology |
DTV |
DIRECTV |
92.48 |
18.34% |
12.18% |
0.44% |
5.32% |
15.68 |
Computer and Technology |
ESRX |
EXPRESS SCRIPTS |
88.09 |
6.72% |
23.25% |
0.50% |
5.98% |
17.22 |
Medical |
GILD |
GILEAD SCIENCES |
118.88 |
12.30% |
46.39% |
1.20% |
14.40% |
12.23 |
Medical |
INTC |
INTEL CORP |
31.95 |
16.29% |
16.95% |
0.77% |
9.25% |
13.65 |
Computer and Technology |
LRCX |
LAM RESEARCH |
82.245 |
20.63% |
32.57% |
0.56% |
6.75% |
16.63 |
Computer and Technology |
MU |
MICRON TECH |
24.48 |
-14.89% |
-14.38% |
0.81% |
9.72% |
7.58 |
Computer and Technology |
MYL |
MYLAN NV |
71.23 |
13.30% |
42.92% |
0.41% |
4.90% |
19.15 |
Medical |
SPLS |
STAPLES INC |
16.255 |
20.41% |
44.49% |
0.60% |
7.17% |
16.76 |
Retail-Wholesale |
STX |
SEAGATE TECH |
53.18 |
44.33% |
-1.02% |
0.48% |
5.74% |
11.06 |
Computer and Technology |
SYMC |
SYMANTEC CORP |
24.1 |
8.49% |
9.60% |
0.62% |
7.45% |
14.49 |
Computer and Technology |
VIAB |
VIACOM INC-B |
66.88 |
-15.33% |
-21.62% |
0.42% |
5.07% |
11.87 |
Consumer Discretionary |
WDC |
WESTERN DIGITAL |
92.02 |
36.72% |
4.75% |
0.60% |
7.19% |
11.65 |
Computer and Technology |
As a bonus to our Newsletter readers,
we are offering a FREE DOWNLOAD of one of our Stock Reports
Read our Complete Detailed Valuation Report on Gilead Sciences HERE.
Below is today's data on GILD:
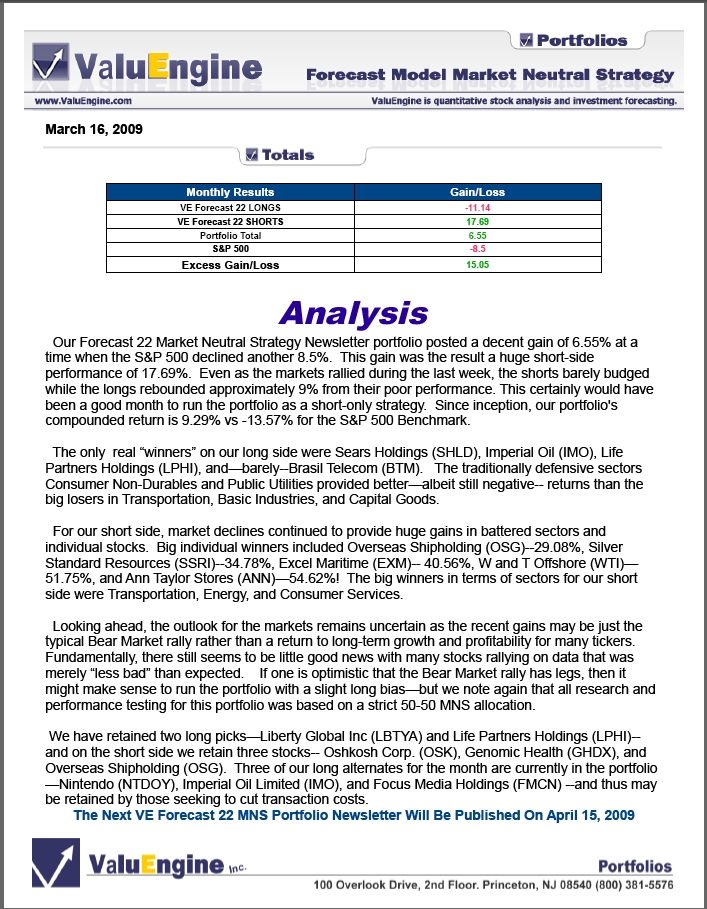
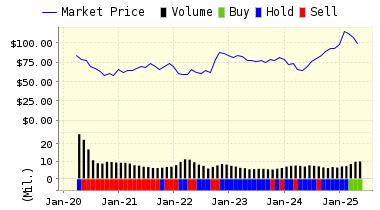
Gilead Sciences, Inc. (GILD) is an independent biopharmaceutical company that seeks to provide accelerated solutions for patients and the people who care for them. They have a broad-based focus on developing and marketing drugs to treat patients with infectious diseases, including viral infections, fungal infections and bacterial infections, and a specialized focus on cancer. They have expertise in liposomal drug delivery technology, a technology that the company uses to develop drugs that are safer, easier for patients to tolerate and more effective.
The company is currently ranked at the top in the NASDAQ 100 based on one-year forecast return. Biotech firms like Gilead have been leading the NASDAQ rally today and helped set the new intraday high.
VALUENGINE RECOMMENDATION: ValuEngine continues its STRONG BUY recommendation on GILEAD SCIENCES for 2015-06-17. Based on the information we have gathered and our resulting research, we feel that GILEAD SCIENCES has the probability to OUTPERFORM average market performance for the next year. The company exhibits ATTRACTIVE Company Size and Sharpe Ratio.
ValuEngine Forecast |
| |
Target
Price* |
Expected
Return |
1-Month |
120.30 |
1.20% |
3-Month |
121.53 |
2.23% |
6-Month |
125.47 |
5.55% |
1-Year |
136.00 |
14.40% |
2-Year |
136.42 |
14.75% |
3-Year |
85.91 |
-27.73% |
Valuation & Rankings |
Valuation |
12.30% overvalued |
|
 38 38 |
1-M Forecast Return |
1.20% |
1-M Forecast Return Rank |
99 |
12-M Return |
46.39% |
|
91 |
Sharpe Ratio |
1.44 |
|
98 |
5-Y Avg Annual Return |
36.66% |
5-Y Avg Annual Rtn Rank |
97 |
Volatility |
25.52% |
|
68 |
Expected EPS Growth |
10.01% |
|
44 |
Market Cap (billions) |
179.35 |
Size Rank |
100 |
Trailing P/E Ratio |
12.23 |
|
88 |
Forward P/E Ratio |
11.12 |
Forward P/E Ratio Rank |
83 |
PEG Ratio |
1.22 |
PEG Ratio Rank |
41 |
Price/Sales |
6.53 |
|
15 |
Market/Book |
32.32 |
|
4 |
Beta |
0.72 |
Beta Rank |
63 |
Alpha |
0.26 |
Alpha Rank |
89 |
Want To Know More About Our ValuEngine View Newsletter?
Looking for a monthly portfolio of stock picks which are objective and based on cutting-edge academic theory and Wall St.practice? Then subscribe to The ValuEngine View Newsletter.The ValuEngine View Portfolio is based on our highly-refined and tested ValuEngine Portfolio Strategies along with our proprietary quant-based composite scoring system. The ValuEngine View Newsletter is the product of sophisticated stock valuation and forecast models first developed by Yale Professor of Finance Zhiwu Chen.
The ValuEngine View Newsletter is the product of a sophisticated stock valuation model that was first developed by ValuEngine's academic research team. It utilizes a three factor approach: fundamental variables such as a company's trailing 12-month Earnings-Per-Share (EPS), the analyst consensus estimate of the company's future 12-month EPS, and the 30-year Treasury yield are all used to create a more accurate reflection of a company's fair value. A total of eleven additional firm specific variables are also used. In addition, the portoflio uses top picks from our Forecast Model. In essence, the portfolio is constructed with the best picks from our main propiretary models
Each month you will receive an electronic copy of our newsletter highlighting 15 potential long positions along with five alternate picks. Our investment strategies focus on dozens of fundamental and technical factors for over 8000 individual stocks, synthesize the data, and then come up with a portfolio. Each newsletter portfolio focuses on maximum potential returns so there are no diversity requirements. Each portfolio pick includes critical ValuEngine valuation and forecast data. These 20 total picks represent the most up-to-date equity assessments of our proprietary models.
Please click HERE to subscribe. You may download a sample copy HERE. After your subscription is approved, you will immediately receive access to download the current issue of newsletter as well as the previous issues, which are all available as PDF files. Each month when the latest issue of the newsletter is released, we will send you an email, informing you to download it from the site. The newsletter is released near the middle of each month.
VE View vs. S&P 500 Index Past Five Years |
|
VE View |
S&P 500 |
Ann Return |
19.75% |
14.13% |
Ann Volatility |
21.06% |
11.13% |
Sharpe Ratio |
0.94 |
1.27 |
Sortino Ratio |
1.55 |
1.56 |
Max Drawdown |
-34.94% |
-11.14% |
The ValuEngine View Newsletter is derived from the ValuEngine Aggressive and Diversified Growth Benchmark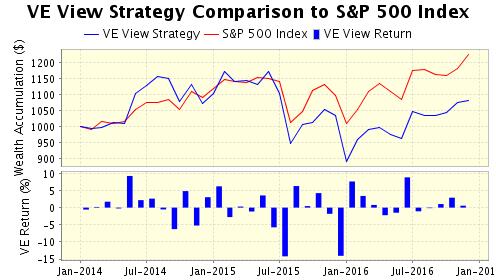 Portfolio Strategies. These strategies are the product of ValuEngine's academic research team and combine cutting-edge financial analysis and portfolio construction techniques with real-world Wall St. know how. Portfolio Strategies. These strategies are the product of ValuEngine's academic research team and combine cutting-edge financial analysis and portfolio construction techniques with real-world Wall St. know how.
CLICK HERE to Subscribe to the ValuEngine View
The ValuEngine View Newsletter portfolio has 15 primary stock picks and five alternates and is re-balanced once each month. The ValuEngine View Newsletter is published near the middle of each calendar month. An equal amount of capital is allocated to each stock. The monthly returns are calculated from the closing prices on date of publication. The performance calculation does not include any transaction costs.
ValuEngine Market Overview
Summary of VE Stock Universe |
Stocks Undervalued |
36.45% |
Stocks Overvalued |
63.55% |
Stocks Undervalued by 20% |
12.73% |
Stocks Overvalued by 20% |
26.77% |
ValuEngine Sector Overview
|
|
|
|
|
|
|
|
-0.47% |
1.24% |
14.25% |
21.20% overvalued |
14.80% |
30.19 |
|
0.05% |
0.59% |
5.69% |
18.58% overvalued |
-4.43% |
21.81 |
|
-0.32% |
0.52% |
8.00% |
15.06% overvalued |
6.94% |
31.17 |
|
-0.16% |
1.60% |
5.45% |
14.64% overvalued |
4.11% |
24.50 |
|
-0.50% |
-0.74% |
2.85% |
13.00% overvalued |
0.70% |
22.47 |
|
0.07% |
0.10% |
1.55% |
12.99% overvalued |
7.73% |
26.22 |
|
-0.07% |
1.03% |
5.37% |
11.64% overvalued |
1.30% |
24.36 |
|
-0.01% |
0.66% |
9.42% |
10.93% overvalued |
1.19% |
27.73 |
|
0.02% |
1.09% |
4.34% |
7.58% overvalued |
3.08% |
17.69 |
|
-0.78% |
-1.12% |
-0.54% |
7.00% overvalued |
-34.63% |
24.54 |
|
-0.22% |
-0.34% |
4.44% |
5.46% overvalued |
-4.76% |
16.86 |
|
-0.44% |
0.47% |
4.34% |
4.95% overvalued |
-4.32% |
20.60 |
|
-0.15% |
-0.16% |
1.06% |
4.07% overvalued |
0.72% |
18.46 |
|
-0.03% |
0.75% |
3.03% |
2.43% overvalued |
0.93% |
24.58 |
|
-0.26% |
-0.09% |
1.72% |
2.38% overvalued |
-14.40% |
24.24 |
|
-0.47% |
-0.79% |
1.44% |
2.15% overvalued |
-5.66% |
21.91 |
ValuEngine.com Products and Services
With the ValuEngine Forecast 16 Market Neutral Strategy Portfolio Newsletter, you can run your own portfolio like a hedge fund to manage risk and profit in any market environment. |
|
|
With ValuEngine.com's Premium Website Membership you get forecasts, valuations, and recommendations on more than 7,000 stocks updated every trading day!
NO OBLIGATION, 14-DAY FREE TRIAL! |
|
 |

|