

July 30, 2015
VALUATION WATCH: Overvalued stocks now make up 51.86% of our stocks assigned a valuation and 19.67% of those equities are calculated to be overvalued by 20% or more. Nine sectors are calculated to be overvalued--with three at or near double digits.
|
||||||||||||||||||||||||||||||||||||||||||||||||||||||||||||||||||||||||||||||||||||||||||||||||||||||||||||||||||||||||||||||||||||||||||||||||||||||||||||||||||||||||||||||||||||||||||||||||||||||||||||||||||||||||||||||||||||||||||||||||||||||||




ValuEngine Forecast |
||
Target Price* |
Expected Return |
|
|---|---|---|
1-Month |
96.79 |
-0.20% |
3-Month |
96.44 |
-0.57% |
6-Month |
97.30 |
0.32% |
1-Year |
94.64 |
-2.43% |
2-Year |
113.46 |
16.99% |
3-Year |
77.68 |
-19.91% |
Valuation & Rankings |
|||
Valuation |
17.47% overvalued |
Valuation Rank(?) |
 23 23 |
1-M Forecast Return |
-0.20% |
1-M Forecast Return Rank |
35 |
12-M Return |
31.58% |
Momentum Rank(?) |
88 |
Sharpe Ratio |
0.75 |
Sharpe Ratio Rank(?) |
85 |
5-Y Avg Annual Return |
34.50% |
5-Y Avg Annual Rtn Rank |
96 |
Volatility |
45.70% |
Volatility Rank(?) |
37 |
Expected EPS Growth |
35.59% |
EPS Growth Rank(?) |
70 |
Market Cap (billions) |
271.28 |
Size Rank |
100 |
Trailing P/E Ratio |
82.19 |
Trailing P/E Rank(?) |
31 |
Forward P/E Ratio |
60.62 |
Forward P/E Ratio Rank |
6 |
PEG Ratio |
2.31 |
PEG Ratio Rank |
19 |
Price/Sales |
20.08 |
Price/Sales Rank(?) |
6 |
Market/Book |
17.25 |
Market/Book Rank(?) |
7 |
Beta |
0.48 |
Beta Rank |
74 |
Alpha |
0.22 |
Alpha Rank |
87 |
As a bonus to our Newsletter readers,
we are offering a FREE DOWNLOAD of one of our Stock Reports
Read our Complete Detailed Valuation Report on FB HERE.
Want To Know More About Our ValuEngine View Newsletter?
Looking for a monthly portfolio of stock picks which are objective and based on cutting-edge academic theory and Wall St.practice? Then subscribe to The ValuEngine View Newsletter.The ValuEngine View Portfolio is based on our highly-refined and tested ValuEngine Portfolio Strategies along with our proprietary quant-based composite scoring system. The ValuEngine View Newsletter is the product of sophisticated stock valuation and forecast models first developed by Yale Professor of Finance Zhiwu Chen.
The ValuEngine View Newsletter is the product of a sophisticated stock valuation model that was first developed by ValuEngine's academic research team. It utilizes a three factor approach: fundamental variables such as a company's trailing 12-month Earnings-Per-Share (EPS), the analyst consensus estimate of the company's future 12-month EPS, and the 30-year Treasury yield are all used to create a more accurate reflection of a company's fair value. A total of eleven additional firm specific variables are also used. In addition, the portoflio uses top picks from our Forecast Model. In essence, the portfolio is constructed with the best picks from our main propiretary models
Each month you will receive an electronic copy of our newsletter highlighting 15 potential long positions along with five alternate picks. Our investment strategies focus on dozens of fundamental and technical factors for over 8000 individual stocks, synthesize the data, and then come up with a portfolio. Each newsletter portfolio focuses on maximum potential returns so there are no diversity requirements. Each portfolio pick includes critical ValuEngine valuation and forecast data. These 20 total picks represent the most up-to-date equity assessments of our proprietary models.
Please click HERE to subscribe. You may download a sample copy HERE. After your subscription is approved, you will immediately receive access to download the current issue of newsletter as well as the previous issues, which are all available as PDF files. Each month when the latest issue of the newsletter is released, we will send you an email, informing you to download it from the site. The newsletter is released near the middle of each month.
VE View vs. S&P 500 Index Past Five Years |
||
VE View |
S&P 500 |
|
|---|---|---|
Ann Return |
19.75% | 14.13% |
Ann Volatility |
21.06% | 11.13% |
Sharpe Ratio |
0.94 | 1.27 |
Sortino Ratio |
1.55 | 1.56 |
Max Drawdown |
-34.94% | -11.14% |
The ValuEngine View Newsletter is derived from the ValuEngine Aggressive and Diversified Growth Benchmark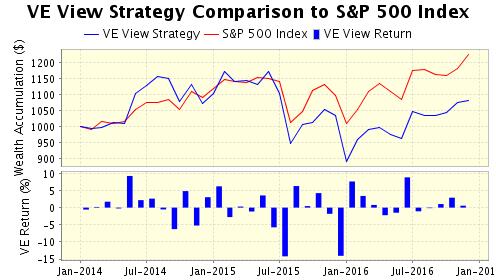 Portfolio Strategies. These strategies are the product of ValuEngine's academic research team and combine cutting-edge financial analysis and portfolio construction techniques with real-world Wall St. know how.
CLICK HERE to Subscribe to the ValuEngine View
The ValuEngine View Newsletter portfolio has 15 primary stock picks and five alternates and is re-balanced once each month. The ValuEngine View Newsletter is published near the middle of each calendar month. An equal amount of capital is allocated to each stock. The monthly returns are calculated from the closing prices on date of publication. The performance calculation does not include any transaction costs.
ValuEngine Market Overview
Summary of VE Stock Universe |
|
Stocks Undervalued |
48.14% |
Stocks Overvalued |
51.86% |
Stocks Undervalued by 20% |
20.42% |
Stocks Overvalued by 20% |
19.67% |
ValuEngine Sector Overview
Sector
|
Change
|
MTD
|
YTD
|
Valuation
|
Last 12-MReturn
|
P/E Ratio
|
-0.03% |
-0.47% |
15.32% |
19.09% overvalued |
16.58% |
30.50 |
|
0.97% |
-0.69% |
5.15% |
14.92% overvalued |
-1.69% |
20.19 |
|
0.35% |
-1.62% |
1.62% |
10.06% overvalued |
0.04% |
22.62 |
|
0.57% |
-3.28% |
-0.91% |
7.06% overvalued |
-5.06% |
25.22 |
|
0.58% |
-1.84% |
6.48% |
6.27% overvalued |
-0.80% |
28.56 |
|
1.33% |
-1.74% |
3.26% |
5.64% overvalued |
-2.66% |
24.23 |
|
0.56% |
-0.98% |
1.85% |
4.32% overvalued |
-0.78% |
17.48 |
|
0.67% |
-2.60% |
-1.67% |
4.10% overvalued |
3.59% |
25.71 |
|
0.14% |
-4.95% |
-0.83% |
4.06% overvalued |
-1.61% |
29.30 |
|
1.29% |
-1.65% |
-3.73% |
0.22% undervalued |
-2.77% |
17.03 |
|
0.88% |
-2.02% |
-2.29% |
0.30% undervalued |
-7.09% |
20.61 |
|
1.53% |
-3.75% |
-2.53% |
1.58% undervalued |
-10.40% |
17.08 |
|
0.68% |
-1.97% |
0.35% |
2.29% undervalued |
0.39% |
23.99 |
|
0.85% |
-5.66% |
-2.32% |
5.68% undervalued |
-8.29% |
19.35 |
|
2.48% |
-10.55% |
-11.32% |
12.77% undervalued |
-45.11% |
22.21 |
|
1.13% |
-9.70% |
-10.95% |
18.24% undervalued |
-35.80% |
22.38 |
ValuEngine.com Products and Services
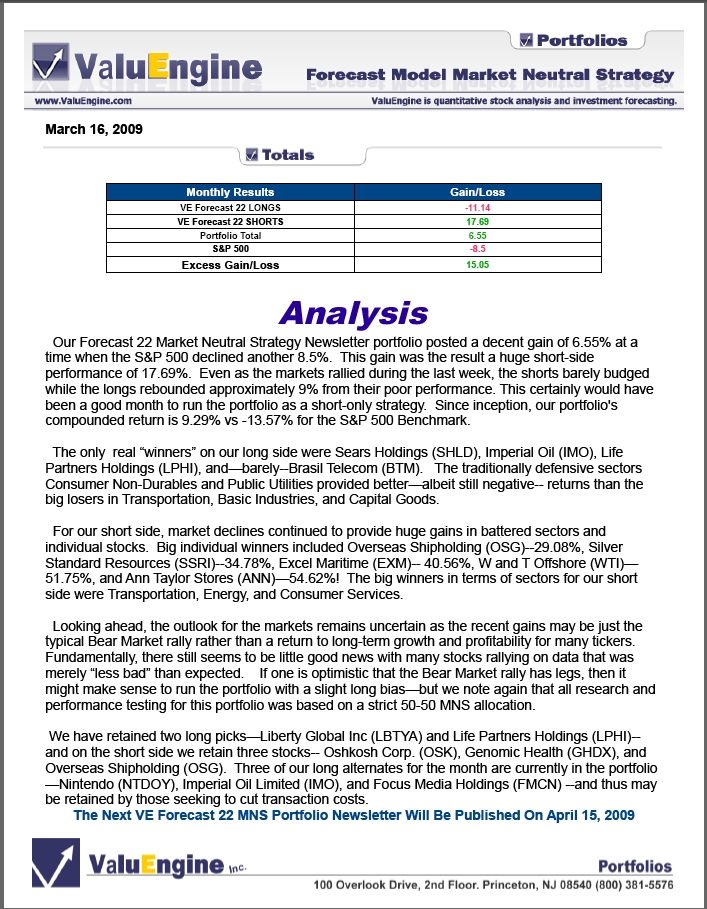
With the ValuEngine Forecast 16 Market Neutral Strategy Portfolio Newsletter, you can run your own portfolio like a hedge fund to manage risk and profit in any market environment. |
 |
|
With ValuEngine.com's Premium Website Membership you get forecasts, valuations, and recommendations on more than 7,000 stocks updated every trading day! NO OBLIGATION, 14-DAY FREE TRIAL! |
 |


