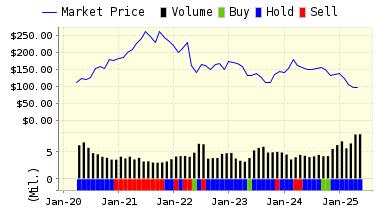
September 30, 2015VALUATION WATCH: Overvalued stocks now make up 31.33% of our stocks assigned a valuation and 9.54% of those equities are calculated to be overvalued by 20% or more. One sector is calculated to be overvalued. Stay On It
|
|||||||||||||||||||||||||||||||||||||||||||||||||||||||||||||||||||||||||||||||||||||||||||||||||||||||||||||||||||||||||||||||||||||||||||||||||||||||||||||||||||||||||||||||||||||||||||||||||||||||||||||||||||||||||||
ValuEngine Forecast |
||
Target Price* |
Expected Return |
|
|---|---|---|
1-Month |
78.41 | 0.56% |
3-Month |
78.97 | 1.28% |
6-Month |
79.91 | 2.47% |
1-Year |
83.19 | 6.68% |
2-Year |
88.86 | 13.96% |
3-Year |
66.74 | -14.41% |
Valuation & Rankings |
|||
Valuation |
0.83% overvalued |
Valuation Rank(?) |
|
1-M Forecast Return |
0.56% |
1-M Forecast Return Rank |
|
12-M Return |
23.70% |
Momentum Rank(?) |
|
Sharpe Ratio |
0.44 |
Sharpe Ratio Rank(?) |
|
5-Y Avg Annual Return |
8.36% |
5-Y Avg Annual Rtn Rank |
|
Volatility |
19.16% |
Volatility Rank(?) |
|
Expected EPS Growth |
13.21% |
EPS Growth Rank(?) |
|
Market Cap (billions) |
49.92 |
Size Rank |
|
Trailing P/E Ratio |
17.46 |
Trailing P/E Rank(?) |
|
Forward P/E Ratio |
15.42 |
Forward P/E Ratio Rank |
|
PEG Ratio |
1.32 |
PEG Ratio Rank |
|
Price/Sales |
0.69 |
Price/Sales Rank(?) |
|
Market/Book |
3.58 |
Market/Book Rank(?) |
|
Beta |
0.62 |
Beta Rank |
|
Alpha |
0.27 |
Alpha Rank |
|
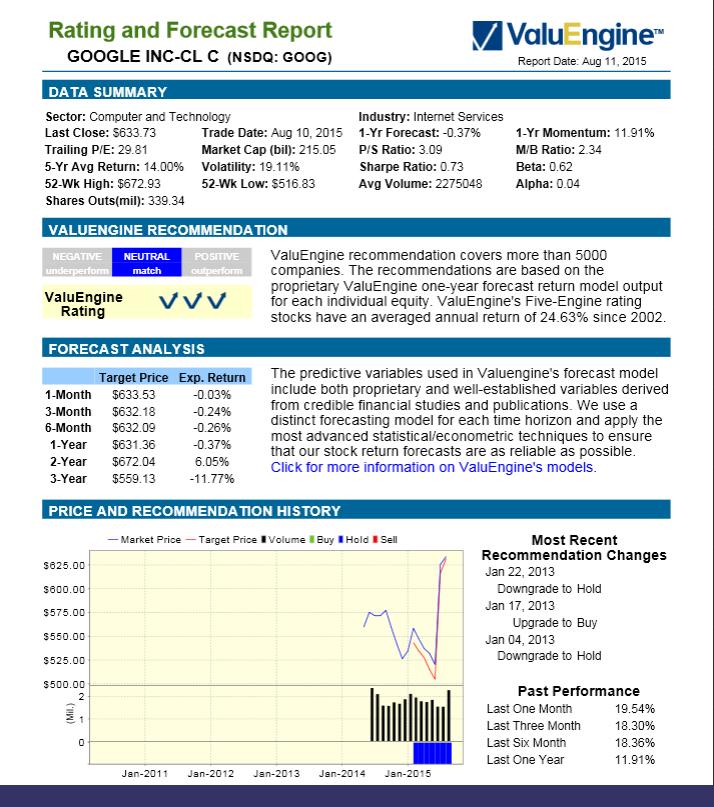
DOWNLOAD A FREE SAMPLE OF OUR TGT REPORT BY CLICKING THE REPORT IMAGE --->
ValuEngine Market Overview
Summary of VE Stock Universe |
|
Stocks Undervalued |
68.67% |
Stocks Overvalued |
31.33% |
Stocks Undervalued by 20% |
32.81% |
Stocks Overvalued by 20% |
9.54% |
ValuEngine Sector Overview
Sector
|
Change
|
MTD
|
YTD
|
Valuation
|
Last 12-MReturn
|
P/E Ratio
|
-0.90% |
-4.27% |
-7.30% |
1.72% overvalued |
-11.65% |
16.54 |
|
-0.28% |
-2.56% |
-6.50% |
1.96% undervalued |
-4.88% |
22.65 |
|
-0.26% |
-2.73% |
-4.22% |
4.08% undervalued |
-5.09% |
16.37 |
|
-0.93% |
-4.90% |
-5.44% |
5.33% undervalued |
-5.02% |
22.11 |
|
-0.64% |
-4.74% |
-10.96% |
5.71% undervalued |
-9.44% |
20.69 |
|
-0.73% |
-4.83% |
-2.97% |
5.98% undervalued |
-6.20% |
24.87 |
|
-1.43% |
-9.37% |
-1.46% |
6.23% undervalued |
-0.43% |
29.39 |
|
-0.32% |
-5.05% |
-10.56% |
7.03% undervalued |
-5.62% |
21.48 |
|
-0.43% |
-4.83% |
-7.76% |
8.05% undervalued |
-8.09% |
26.77 |
|
-0.80% |
-6.27% |
-9.48% |
11.94% undervalued |
-6.28% |
19.66 |
|
-0.53% |
-5.42% |
-12.85% |
12.28% undervalued |
-10.99% |
18.46 |
|
0.17% |
-7.06% |
-13.37% |
15.76% undervalued |
-13.01% |
13.75 |
|
-0.27% |
-6.06% |
-13.84% |
16.04% undervalued |
-16.79% |
17.32 |
|
-0.40% |
-7.27% |
-16.90% |
17.23% undervalued |
-17.35% |
14.94 |
|
-1.38% |
-15.92% |
-27.40% |
21.74% undervalued |
-51.60% |
22.41 |
|
-0.19% |
-9.77% |
-21.87% |
23.00% undervalued |
-32.70% |
19.09 |
Visit www.ValuEngine.com for more information


