
July 26, 2016VALUATION WATCH: Overvalued stocks now make up 45.8% of our stocks assigned a valuation and 15.29% of those equities are calculated to be overvalued by 20% or more. Seven sectors are calculated to be overvalued. If you cannot display this bulletin properly, GO HERE Nice ViewValuEngine View Portfolio Rides Brexit Bounce To 8% GainFor June/July, we had a great month as the markets shook off the “Brexit” fallout and powered up once again. Our long-only ValueEngine View portfolio matched the upswing perfectly with a big gain of 8.82%. We beat the benchmark S&P 500's similar gain of 8.39% by 43 bps. The trailing 12 month gain of the VE View is -5.23% versus the S&P 500 gain of 2.9%. The return since inception of the View is 108.25% versus the S&P's gain of 91.48%. We had a perfect 100% hit ratio this month with 15/15 winning positions. Seven of our picks provided double-digit returns with Thor Industries leading the way with a great 22% pick up. Other double-digit returns came from Cooper-Standard, AMN Health Care, Employers Holdings, Smith and Wesson, and Windstream. The big gains meant that none of our picks hit stop-losses levels set at 10%. We will retain those stops at the 10% level moving forward. Currently, the Valuation Model finds that 45.8% of the equities to which we can assign a valuation are overvalued--with 15.29% coming in overvalued at 20% or more. Seven sectors are calculated to be overvalued. Our valuation figures still show a "normal" market, with valuations nowhere near that bargain level they presented in the immediate aftermath of the Brexit vote. The markets in the US and elsewhere certainly shook off that Brexit panic, with several indices setting new records over the past few weeks. Many analysts found that the uncertainty in the EU removed any possible scenario where the Fed would raise rates any time soon. Of course, that is not to say that some Fed officials don't favor increases, but the time to hit the brakes may have passed by given the fact that the US is in the midst of a presidential election, and the central bank is notoriously skittish about any hint of political bias. In our July portfolio, we turnover just four positions. On a sector basis the model likes Consumer Discretionary stocks and Tech stocks, We add one selection from our Valuation model's aggressive-growth strategy, one position from our Forecast model's diversified-growth strategy, and two positions favored by both. Below are the latest results from our VE View Strategy Newsletter:
Below, we provide the data on Cooper-Standard (CPS), one of our portfolio leader for the month: Cooper-Standard Holdings Inc. operates as a supplier of systems and components for the automotive industry. Its products include sealing and trim, fuel and brake delivery, fluid transfer, thermal and emissions and anti-vibration systems. The company markets its products directly to automotive original equipment manufacturers, tier I and tier II suppliers, and non-automotive manufacturers. Cooper-Standard Holdings Inc. is headquartered in Novi, Michigan. 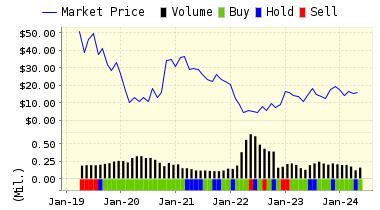
DOWNLOAD A FREE SAMPLE OF OUR COOPER STANDARD (CPS) REPORT BY CLICKING HERE
ValuEngine Market Overview
ValuEngine Sector Overview
ValuEngine.com is an independent research provider, producing buy/hold/sell recommendations, target price, and valuations on over 7,000 US and Canadian equities every trading day.
Visit www.ValuEngine.com for more information
|
|||||||||||||||||||||||||||||||||||||||||||||||||||||||||||||||||||||||||||||||||||||||||||||||||||||||||||||||||||||||||||||||||||||||||||||||||||||||||||||||||||||||||||||||||||||||||||||||||||||||||||||||||||||||||||||||||||||||||||||||||||||||||||||||||||||||||||||||||||||||||||||||||||||||||||||||||||||||||||||||||||||||


