September 14, 2016
VALUATION WATCH: Overvalued stocks now make up 46.19% of our stocks assigned a valuation and 14.89% of those equities are calculated to be overvalued by 20% or more. Eight sectors are calculated to be overvalued.
If you cannot display this bulletin properly, GO HERE
Fashion Weak?
Under Armour Goes Upscale In NYC
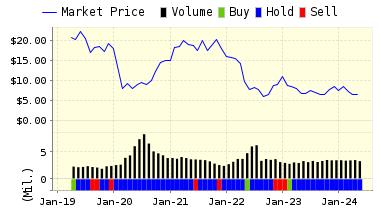
Under Armour (UA) is a leading developer, marketer and distributor of branded performance products for men, women and youth. The brand's moisture-wicking synthetic fabrications are engineered in many different designs and styles for wear in nearly every climate to provide a performance alternative to traditional natural fiber products. The Company is an official supplier to the National Hockey League, the U.S. Ski Team, USA Rugby, the National Lacrosse League, and Major League Lacrosse; and the Company's products are worn by professional football, baseball, and soccer players, as well as athletes in major collegiate and Olympic sports. The Company's products are currently sold in the United States, Canada, Japan and the United Kingdom.
Up to this point, the company has dominated in gyms and amongst athletes and fitness types. But they hope to change that--and bolster their bottom line-- via the creation of a more high-end sort of clothing. So, UnderArmour will show their new line at New York's prestigious fashion week. The new line includes blazers, button-down shirts, trousers, and other items favored by city-dwellers in big US east coast cities.
Under Armour promises that this clothing will be professional, suited for the office, and "fashion casual" rather than their more traditional athletic wear. They are aiming at a market of young urban professionals, and others seeking good-looking "normal" office dress with a bit of technical flair. The clothes, which go one sale tomorrow, will be featured at Barneys, New York as well as a new website specifically for them, and individual Under Armour stores.
How this will work, and if it will help to make Under Armour stand out from lower-margin athletic wear firms remains to be seen. Our models have been down on the company for a while now.
ValuEngine continues its SELL recommendation on Under Armour for 2016-09-13. Based on the information we have gathered and our resulting research, we feel that Under Armour has the probability to UNDERPERFORM average market performance for the next year. The company exhibits UNATTRACTIVE Book Market Ratio and Momentum.
You can download a free copy of detailed report on Under Armour (UA) from the link below.
ValuEngine Forecast |
| |
Target
Price* |
Expected
Return |
1-Month |
38.09 |
-0.62% |
3-Month |
37.71 |
-1.62% |
6-Month |
37.29 |
-2.72% |
1-Year |
35.46 |
-7.48% |
2-Year |
38.71 |
0.99% |
3-Year |
41.25 |
7.62% |
Valuation & Rankings |
Valuation |
1.50% undervalued |
|
 50 50 |
1-M Forecast Return |
-0.62% |
1-M Forecast Return Rank |
14 |
12-M Return |
-22.83% |
|
21 |
Sharpe Ratio |
1.03 |
|
96 |
5-Y Avg Annual Return |
29.31% |
5-Y Avg Annual Rtn Rank |
96 |
Volatility |
28.33% |
|
60 |
Expected EPS Growth |
24.54% |
|
62 |
Market Cap (billions) |
8.20 |
Size Rank |
89 |
Trailing P/E Ratio |
70.55 |
|
36 |
Forward P/E Ratio |
56.65 |
Forward P/E Ratio Rank |
6 |
PEG Ratio |
2.87 |
PEG Ratio Rank |
16 |
Price/Sales |
1.85 |
|
48 |
Market/Book |
7.32 |
|
18 |
Beta |
0.55 |
Beta Rank |
66 |
Alpha |
-0.27 |
Alpha Rank |
22 |

DOWNLOAD A FREE SAMPLE OF OUR UNDER ARMOUR (UA) REPORT BY CLICKING HERE
ValuEngine Market Overview
Summary of VE Stock Universe |
Stocks Undervalued |
53.81% |
Stocks Overvalued |
46.19% |
Stocks Undervalued by 20% |
21.39% |
Stocks Overvalued by 20% |
14.89% |
ValuEngine Sector Overview
|
|
|
|
|
|
|
|
-1.66% |
-2.24% |
5.91% |
17.00% overvalued |
1.70% |
19.81 |
|
-3.13% |
-1.30% |
28.44% |
3.19% overvalued |
-4.95% |
24.56 |
|
-1.18% |
-0.84% |
13.98% |
3.10% overvalued |
7.55% |
29.22 |
|
-1.68% |
-1.75% |
13.80% |
3.06% overvalued |
9.62% |
22.55 |
|
-1.19% |
-1.87% |
8.48% |
3.00% overvalued |
12.85% |
24.05 |
|
-2.77% |
-1.31% |
42.48% |
2.25% overvalued |
62.20% |
30.33 |
|
-2.16% |
-1.54% |
8.76% |
1.28% overvalued |
14.72% |
21.27 |
|
-0.83% |
1.06% |
-0.07% |
0.89% overvalued |
1.54% |
18.04 |
|
-1.39% |
-1.24% |
5.79% |
0.23% undervalued |
4.71% |
16.33 |
|
-1.37% |
-1.26% |
8.97% |
1.18% undervalued |
1.32% |
24.25 |
|
-0.91% |
-0.77% |
7.40% |
1.24% undervalued |
2.86% |
23.52 |
|
-1.92% |
-0.76% |
10.65% |
2.89% undervalued |
-15.46% |
14.99 |
|
-1.29% |
-2.56% |
26.73% |
5.05% undervalued |
9.25% |
19.57 |
|
-1.65% |
-0.44% |
4.04% |
6.96% undervalued |
2.68% |
13.38 |
|
-1.44% |
-0.12% |
0.08% |
7.19% undervalued |
-15.35% |
27.04 |
|
-1.12% |
-1.94% |
-0.71% |
7.81% undervalued |
-4.72% |
21.97 |
ValuEngine.com is an independent research provider, producing buy/hold/sell recommendations, target price, and valuations on over 7,000 US and Canadian equities every trading day.
Visit www.ValuEngine.com for more information

|


