October 12, 2016
VALUATION WATCH: Overvalued stocks now make up 46.58% of our stocks assigned a valuation and 14.94% of those equities are calculated to be overvalued by 20% or more. Six sectors are calculated to be overvalued.
If you cannot display this bulletin properly, GO HERE
SambaDrome
Brazilian Stocks Are Hot For ValuEngine Models
We use trading data to provide forecast estimates for a variety of time horizons for almost ever equity in our database. Our Buy/Sell/Hold recommendations are based upon the 1-year forecast return figure. Using valuation and forecast figures, you can rank and rate our covered stocks against each other, to find out, in an objective and systematic way, the most attractive investment targets based on your own risk/reward parameters. We re-calculate the entire database every trading day, so you are assured that every proprietary valuation and forecast datapoint is as up-to-date as possible.
We can "slice and dice" our database in a variety of ways, and one of the things we can search for are foreign stocks in hot markets. We often hear of emerging markets as a good place for investors because they offer the possibility of high growth at a time when more "mature" national economies may not feature oversized returns. Of course, emerging markets can also be tricky as currency fluctuations, social unrest, corruption, lack of regulation, etc. may exist in ways that are both different and potentially more damaging to stocks.
But, for those willing to take the risk, the rewards can be high even when their home market may be declining or stagnant. Some of the most popular emerging markets are the so-called "BRIC" countries (Brazil, Russia, India, China.) From our models' perspective, one of the hottest BRIC markets right now is Brazil. We have notice many Brazilian companies showing up in our screens for top forecast stocks latgely, and some of them have also provided a performance boost ot our various portfolio startegies.
So, for today's bulletin we used our database to search for the top-rated BUY and STRONG BUY stocks from Brazil that trade on US stock markets. Here you can find "the best of both worlds," stocks from foreign countries that trade on US exchanges and thus must meet the more rigorous regulatory requirements while still offering the potential benefits of emerging-market companies.
Keep in mind that Brazil recently has had a variety of corruption scandals dealing with the national oil company and other firms--and they removed their President when her investigation into that corruption began to ruffle a few too many highly-placed "feathers." Their economy has been in trouble/recession, and the political scandal has certainly not helped. But, the stocks we can track from Brazil have outperformed over the past year.
Below, you can see our latest data for the top-ten stocks in our systems from Brazil. These companies are all rated STRONG BUY, and-- as you can see from the LTM Return data, they have all been on a tear for the past year with returns ranging from 25% to a whopping 338%. We do not have full data--both valuation and forecast--for all of these stocks, so keep that in mind.
Ticker |
Company Name |
Market Price |
Valuation |
Last 12-M Retrn |
1-M Forecast Retn |
1-Yr Forecast Retn |
P/E Ratio |
Sector Name |
BDORY |
BANCO DO BRASIL |
7.74 |
N/A |
58.28% |
1.49% |
17.98% |
4.86 |
Finance |
SBS |
SABESP -ADR |
9.6 |
-0.95% |
112.39% |
1.43% |
17.30% |
10.55 |
Utilities |
CZZ |
COSAN LTD-A |
7.93 |
N/A |
116.08% |
1.41% |
17.01% |
10.94 |
Basic Materials |
BBDO |
BANCO BRADE-ADR |
9.16 |
N/A |
36.16% |
1.32% |
15.95% |
6.62 |
Finance |
CIG |
CEMIG SA -ADR |
2.68 |
N/A |
32.67% |
1.28% |
15.49% |
4.07 |
Utilities |
BAK |
BRASKEM SA |
16.35 |
9.36% |
66.50% |
1.18% |
14.23% |
11.68 |
Oils-Energy |
ELP |
COPEL-ADR PR B |
10.83 |
N/A |
25.35% |
1.17% |
14.03% |
6.51 |
Utilities |
ITUB |
BANCO ITAU -ADR |
11.88 |
11.70% |
55.91% |
1.13% |
13.58% |
11.21 |
Finance |
BBD |
BANCO BRADESCO |
9.58 |
25.08% |
68.88% |
1.11% |
13.33% |
11.27 |
Finance |
EBRYY |
ELETROBRAS-ADR |
6.44 |
N/A |
338.10% |
1.11% |
13.31% |
N/A |
Utilities |
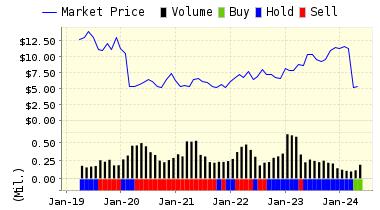
Here is more in-depth data on Banco de Brasil (BDORY), our leading Brazilian STRONG BUY as of today:
Banco do Brasil S.A (BDORY) provides retail and commercial banking services in Brazil and internationally. The services offered includes consumer, commercial, and agribusiness loans, asset management, foreign exchange, insurance, lease financing and Internet banking services. The Company also offers services including credit recovery, consortium administration, development, manufacture, commercialization, rent, and integration of digital electronic systems and equipment, peripherals, programs, inputs, and computing supplies. Banco do Brasil S.A is headquartered in Brasilia, Brazil.
VALUENGINE RECOMMENDATION: ValuEngine continues its STRONG BUY recommendation on BANCO DO BRASIL for 2016-10-11. Based on the information we have gathered and our resulting research, we feel that BANCO DO BRASIL has the probability to OUTPERFORM average market performance for the next year. The company exhibits ATTRACTIVE P/E Ratio and Company Size.
You can download a free copy of detailed report on Banco de Brasil (BDORY) from the link below.
ValuEngine Forecast |
| |
Target
Price* |
Expected
Return |
1-Month |
7.86 |
1.49% |
3-Month |
8.03 |
3.80% |
6-Month |
8.16 |
5.44% |
1-Year |
9.13 |
17.98% |
2-Year |
8.13 |
5.01% |
3-Year |
7.81 |
0.88% |
Valuation & Rankings |
Valuation |
n/a |
|
 n/a n/a |
1-M Forecast Return |
1.49% |
1-M Forecast Return Rank |
100 |
12-M Return |
58.28% |
|
92 |
Sharpe Ratio |
-0.22 |
|
32 |
5-Y Avg Annual Return |
-12.36% |
5-Y Avg Annual Rtn Rank |
29 |
Volatility |
55.59% |
|
32 |
Expected EPS Growth |
10.04% |
|
40 |
Market Cap (billions) |
22.18 |
Size Rank |
95 |
Trailing P/E Ratio |
4.86 |
|
99 |
Forward P/E Ratio |
4.41 |
Forward P/E Ratio Rank |
98 |
PEG Ratio |
0.48 |
PEG Ratio Rank |
60 |
Price/Sales |
0.41 |
|
86 |
Market/Book |
1.14 |
|
72 |
Beta |
2.73 |
Beta Rank |
5 |
Alpha |
0.28 |
Alpha Rank |
87 |

DOWNLOAD A FREE SAMPLE OF OUR BANCO DE BRASIL (BDORY) REPORT BY CLICKING HERE
ValuEngine Market Overview
Summary of VE Stock Universe |
Stocks Undervalued |
53.42% |
Stocks Overvalued |
46.58% |
Stocks Undervalued by 20% |
21.31% |
Stocks Overvalued by 20% |
14.94% |
ValuEngine Sector Overview
|
|
|
|
|
|
|
|
0.68% |
-2.37% |
15.94% |
5.03% overvalued |
12.76% |
23.20 |
|
-0.92% |
-1.65% |
16.55% |
4.15% overvalued |
8.16% |
29.81 |
|
0.67% |
2.10% |
21.33% |
3.82% overvalued |
-3.55% |
25.54 |
|
-0.70% |
-2.10% |
9.00% |
2.56% overvalued |
11.52% |
21.37 |
|
0.73% |
-1.04% |
6.59% |
1.57% overvalued |
1.01% |
20.76 |
|
0.56% |
-1.90% |
8.74% |
0.93% overvalued |
8.72% |
23.78 |
|
0.11% |
-1.10% |
6.36% |
0.37% undervalued |
3.13% |
16.50 |
|
-0.85% |
-0.78% |
1.93% |
0.93% undervalued |
5.40% |
17.93 |
|
2.16% |
-2.83% |
40.60% |
1.36% undervalued |
50.87% |
28.33 |
|
0.25% |
-1.95% |
12.43% |
1.92% undervalued |
-0.12% |
24.31 |
|
-0.11% |
0.18% |
11.33% |
2.77% undervalued |
-14.85% |
16.77 |
|
-0.50% |
-1.27% |
8.16% |
3.54% undervalued |
-0.24% |
22.93 |
|
-0.84% |
-0.39% |
7.16% |
4.60% undervalued |
3.75% |
15.11 |
|
-1.49% |
-0.78% |
1.94% |
4.79% undervalued |
-7.03% |
25.72 |
|
0.26% |
-1.45% |
29.58% |
5.56% undervalued |
13.36% |
19.71 |
|
0.93% |
-0.57% |
0.04% |
6.08% undervalued |
-0.28% |
21.95 |
ValuEngine.com is an independent research provider, producing buy/hold/sell recommendations, target price, and valuations on over 7,000 US and Canadian equities every trading day.
Visit www.ValuEngine.com for more information

|


