February 26, 2014
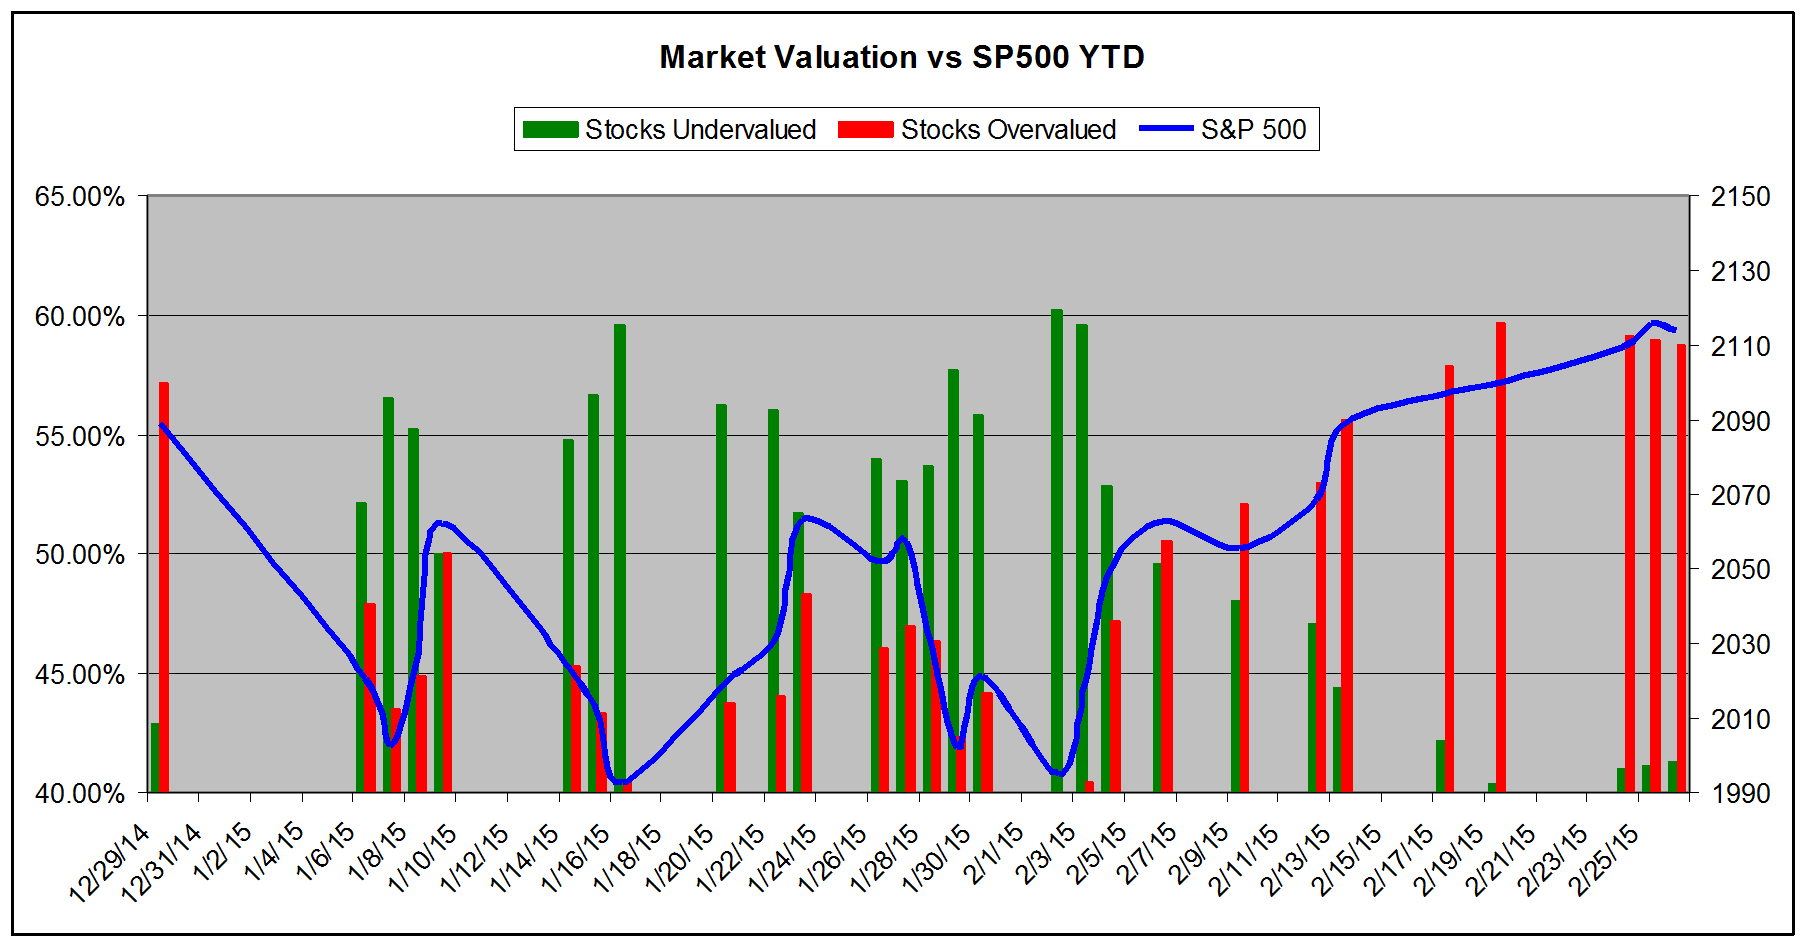
Click HERE to Download a FREE Sample of the ValuEngine View NewsletterVALUATION WATCH: Overvalued stocks now make up 58.76% of our stocks assigned a valuation and 19.91% of those equities are calculated to be overvalued by 20% or more. Twelve sectors are calculated to be overvalued--six by double digits. The New "Normal"ValuEngine tracks more than 7000 US equities, ADRs, and foreign stock which trade on US exchanges as well as @1000 Canadian equities. When EPS estimates are available for a given equity, our model calculates a level of mispricing or valuation percentage for that equity based on earnings estimates and what the stock should be worth if the market were totally rational and efficient--an academic exercise to be sure, but one which allows for useful comparisons between equities, sectors, and industries. Using our Valuation Model, we can currently assign a VE valuation calculation to more than 2900 stocks in our US Universe. We combine all of the equities with a valuation calculation to track market valuation figures and use them as a metric for making calls about the overall state of the market. Two factors can lower these figures-- a market pullback, or a significant rise in EPS estimates. Vice-versa, a significant rally or reduction in EPS can raise the figure. Whenever we see overvaluation levels in excess of @ 65% for the overall universe and/or 27% for the overvalued by 20% or more categories, we issue a valuation warning. We now calculate that 58.76% of stocks are overvalued and 19.91% of those stocks are overvalued by 20% or more. Thus we have seen a relatively large shift in overvaluation over the past month. However, these figures are down significantly from where they were for much of 2014. We are still within "normal" range for valuation, but a strong leg up could put us back into Valuation Warning range. What seems more significant is that the models have adjusted to the new higher levels for the SP500. For much of 2014 a market at 2100 would have pegged our overvaluation figures to a much higher range. In fact, one year ago, with the SP500 at 1875 or so, we had overvaluation numbers at @80%. Now, SP500 at 1900 seems like a buying opportunity. And let's remember the fact that despite all the doom and gloom from certain quarters in Washington and New York over the past six years, this has been one of the most remarkable rallies in US history. Since the 666 inter day SP500 low of March 2009, that index is up more than 210%, the Dow is up more than 175%, and the NASDAQ has jumped a massive 292%--meanwhile GLD (the SPDR Gold ETF) the scaremongers choice--is up a paltry 28%. Given a similar stock market rally under a Republican administration, you can be sure we would have heard talk about how the country was "saved" by the wise policies of that President for decades to come. In addition to the valuation calculations, we find other reasons to remain optimistic about stocks. The latest news from Janet Yellen's Fed remains positive for US equities in the short term. Adjustments have been made to oil at @$50/barrel and the US is in an enviable position vis-a-vis energy right now. Employment is picking up steam—witness the latest announced wage increases from Wal-Mart, who is dealing with pressure from within and without when it comes to compensation. Let's just hope Congress doesn't screw up this momentum with any more ill-advised austerity moves or shut downs (partial or not.) Subscribers Get FULL ACCESS to our Market and Sector Overviews The chart below tracks the valuation metrics from January 2015. It shows levels in excess of 40%.
This chart shows overall universe over valuation in excess of 40% vs the S&P 500 from January 2014
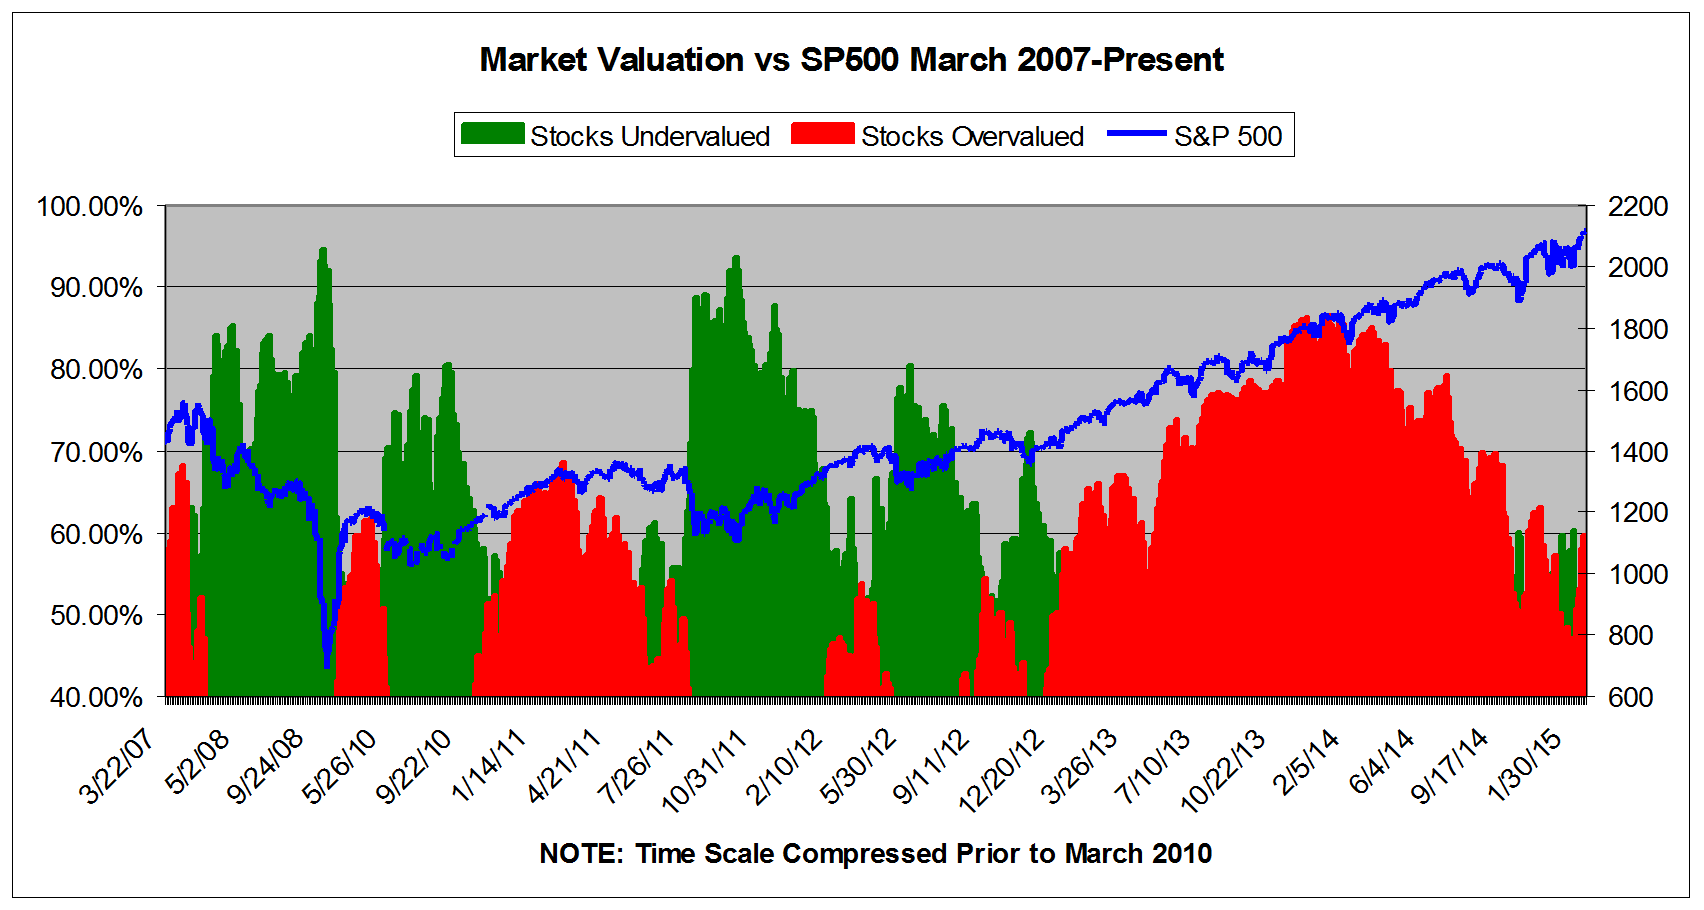
This chart shows overall universe under and over valuation in excess of 40% vs the S&P 500 from March 2007*
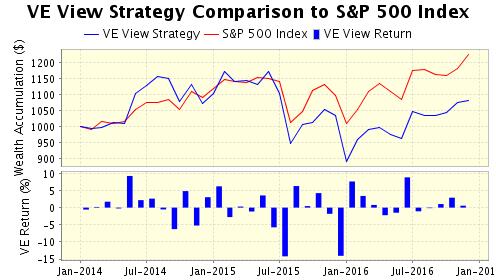
Want To Know More About Our ValuEngine View Newsletter?Looking for a monthly portfolio of stock picks which are objective and based on cutting-edge academic theory and Wall St.practice? Then subscribe to The ValuEngine View Newsletter.The ValuEngine View Portfolio is based on our highly-refined and tested ValuEngine Portfolio Strategies along with our proprietary quant-based composite scoring system. The ValuEngine View Newsletter is the product of sophisticated stock valuation and forecast models first developed by Yale Professor of Finance Zhiwu Chen. The ValuEngine View Newsletter is the product of a sophisticated stock valuation model that was first developed by ValuEngine's academic research team. It utilizes a three factor approach: fundamental variables such as a company's trailing 12-month Earnings-Per-Share (EPS), the analyst consensus estimate of the company's future 12-month EPS, and the 30-year Treasury yield are all used to create a more accurate reflection of a company's fair value. A total of eleven additional firm specific variables are also used. In addition, the portoflio uses top picks from our Forecast Model. In essence, the portfolio is constructed with the best picks from our main propiretary models Each month you will receive an electronic copy of our newsletter highlighting 15 potential long positions along with five alternate picks. Our investment strategies focus on dozens of fundamental and technical factors for over 8000 individual stocks, synthesize the data, and then come up with a portfolio. Each newsletter portfolio focuses on maximum potential returns so there are no diversity requirements. Each portfolio pick includes critical ValuEngine valuation and forecast data. These 20 total picks represent the most up-to-date equity assessments of our proprietary models. Please click HERE to subscribe. You may download a sample copy HERE. After your subscription is approved, you will immediately receive access to download the current issue of newsletter as well as the previous issues, which are all available as PDF files. Each month when the latest issue of the newsletter is released, we will send you an email, informing you to download it from the site. The newsletter is released near the middle of each month.
The ValuEngine View Newsletter is derived from the ValuEngine Aggressive and Diversified Growth Benchmark CLICK HERE to Subscribe to the ValuEngine View The ValuEngine View Newsletter portfolio has 15 primary stock picks and five alternates and is re-balanced once each month. The ValuEngine View Newsletter is published near the middle of each calendar month. An equal amount of capital is allocated to each stock. The monthly returns are calculated from the closing prices on date of publication. The performance calculation does not include any transaction costs. ValuEngine Market Overview
ValuEngine Sector Overview
ValuEngine.com Products and Services
|
||||||||||||||||||||||||||||||||||||||||||||||||||||||||||||||||||||||||||||||||||||||||||||||||||||||||||||||||||||||||||||||||||||||||||||||||||||||||||||||||