Go to ValuEngine.com

June 25, 2014


ATTENTION Advanced Investors and Finance Professionals:
If you are reading this you should download ValuEngine Institutional Software to see how VE’s powerful quantitative tools can increase your productivity and effectiveness.

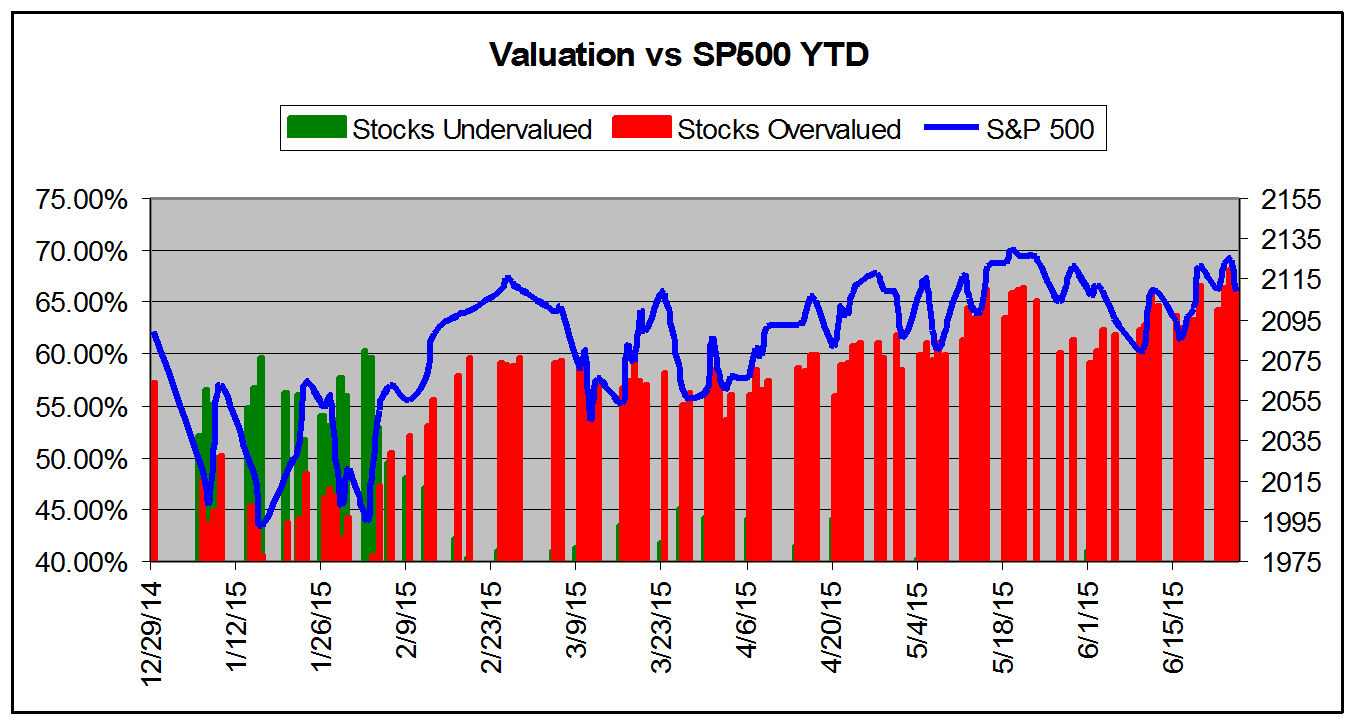
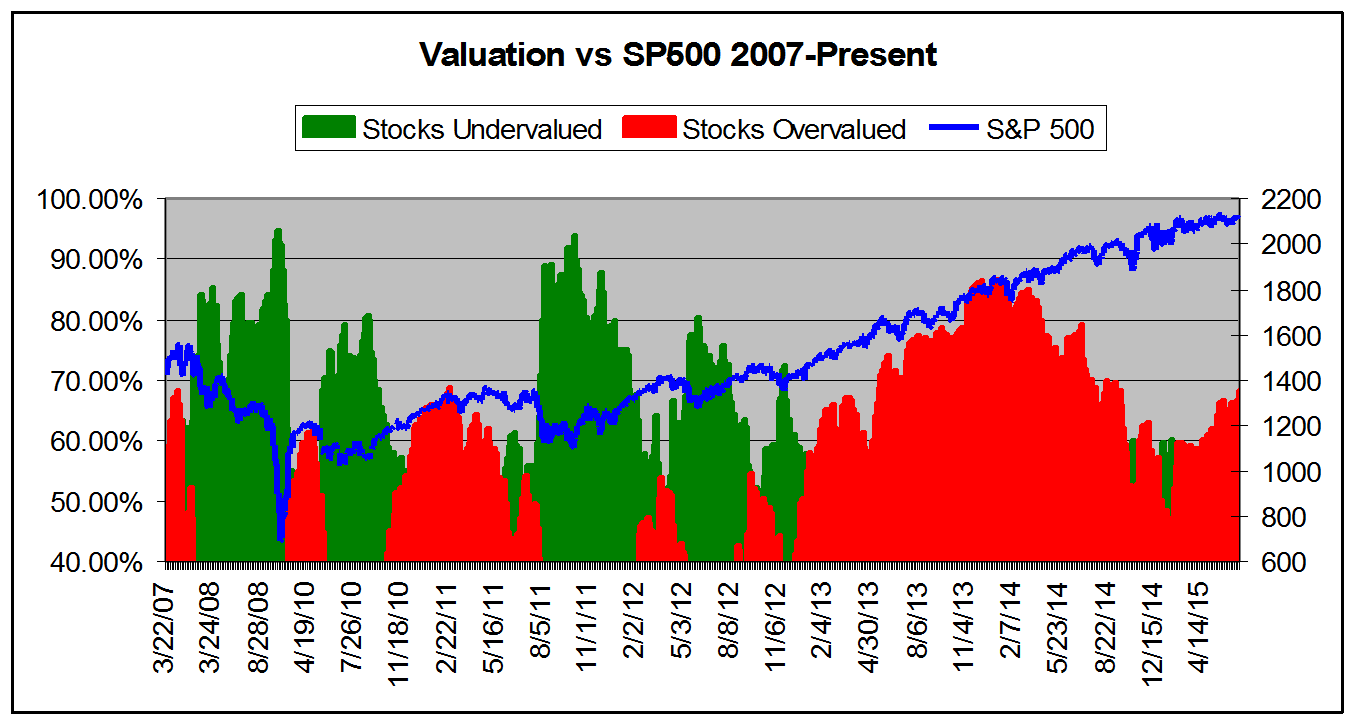
Click HERE to Download a FREE Sample of the ValuEngine View Newsletter

VALUATION WARNING:Overvalued stocks now make up 65.8% of our stocks assigned a valuation and 28.29% of those equities are calculated to be overvalued by 20% or more.  ALL sectors are calculated to be overvalued--with nine at or near double digits.

Valued
Valuations Tip Into Warning Range Again

ValuEngine tracks more than 7000 US equities, ADRs, and foreign stock which trade on US exchanges as well as @1000 Canadian equities.  When EPS estimates are available for a given equity, our model calculates a level of mispricing or valuation percentage for that equity based on earnings estimates and what the stock should be worth if the market were totally rational and efficient--an academic exercise to be sure, but one which allows for useful comparisons between equities, sectors, and industries. Using our Valuation Model, we can currently assign a VE valuation calculation to more than 2800 stocks in our US Universe.

We combine all of the equities with a valuation calculation to track market valuation figures and use them as a metric for making calls about the overall state of the market.  Two factors can lower these figures-- a market pullback, or a significant rise in EPS estimates. Vice-versa, a significant rally or reduction in EPS can raise the figure. Whenever we see overvaluation levels in excess of @ 65% for the overall universe and/or 27% for the overvalued by 20% or more categories, we issue a valuation warning. 

We now calculate that 65.8% of stocks are overvalued and 28.29% of those stocks are overvalued by 20% or more. These figures have been fluctuating with increasing volatility, but have pretty much been pinned in this range for much of the past few months. We did our last valuation study on May7th, and with our latest moves to new records, the values have elevated slightly and now reside right on the cusp of our warning level. However, these figures are down significantly from where they were for much of 2013-2014-- when the SP500 was trading in the 1800-2000 range.

Recent news from the Fed gave the markets yet more impetus for a move to the upside. Confirmation that rates will rise, but not quite yet, coupled with the reassertion that the central bank will provide attention to BOTH sides of its mandate--controlling inflation AND promoting full employment--once more indicated that US equities will remain "the only game in town" for a bit longer.

Thus, the latest from the Fed confirmed what we had discussed the last time we took a look at our valuations--Yellen et al will make sure workers garner some benefits as they set their rate increase schedule.

Finally, the recovery has taken hold for all, with wage pressures leading to boosts for workers at McDonald's Wal-Mart, Target, TJMaxx, etc. At the same time, prices remain relatively stable, with a low inflation environment thanks to a respite from high energy prices--and the longer-term deflationary effects of the greatest financial melt down since the Great Depression.

This is as it should be, labor has been the neglected part of the equation and various austerity measures hindered the recovery and the unemployment rate. We see evidence of this from various parts of the country as long-held right-wing shibboleths are challenged by "reality" and its Colbert-esque "well-known liberal bias." The latest examples of this being the budget shambles in Kansas--whose Republican administration slashed taxes in a move directly drawn from Arthur Laffer only to see employment lag, huge budget deficits, and an eventual tax hike--and Seattle--whose Democratic officials raised the minimum wage and have seen a continuing economic boom.

Again, we have seen one of the most remarkable market rallies in history. Since the Obama Administration took office the Dow is up @117%, the NASDAQ @247%, and the SP500 is up @153%. An amazing time for investors-- as long as they did not fall prey to the "BUY GUNS BUY GOLD BUY SEEDS!" crowd of pundits and money-losing prognosticators.

--It is a rather amusing exercise to read the alarmist nonsense from various political ideologues circa 2009 warning of total economic collapse, a worthless US currency, a socialist takeover of the US economy, etc.

And again, "Sell in May and Go Away"? So far, not so much. But, as always, we remind investors that valuations calculated at these levels indicate a time for some profit taking and hedging for a move to the downside. Make sure to be prepared for a Summer swoon or some unexpected calamity from the Eurozone--the long-feared "Grexit," etc.

Subscribers Get FULL ACCESS to our Market and Sector Overviews

The chart below tracks the valuation metrics from January 2015. It shows levels in excess of 40%.

   This chart shows overall universe over valuation in excess of 40% vs the S&P 500 from January 2014

 This chart shows overall universe under and over valuation in excess of 40% vs the S&P 500 from March 2007*

 *NOTE: Time Scale Compressed Prior to 2011.

Want To Know More About Our ValuEngine View Newsletter?

Looking for a monthly portfolio of stock picks which are objective and based on cutting-edge academic theory and Wall St.practice? Then subscribe to The ValuEngine View Newsletter.The ValuEngine View Portfolio is based on our highly-refined and tested ValuEngine Portfolio Strategies along with our proprietary quant-based composite scoring system. The ValuEngine View Newsletter is the product of sophisticated stock valuation and forecast models first developed by Yale Professor of Finance Zhiwu Chen.

The ValuEngine View Newsletter is the product of a sophisticated stock valuation model that was first developed by ValuEngine's academic research team. It utilizes a three factor approach: fundamental variables such as a company's trailing 12-month Earnings-Per-Share (EPS), the analyst consensus estimate of the company's future 12-month EPS, and the 30-year Treasury yield are all used to create a more accurate reflection of a company's fair value. A total of eleven additional firm specific variables are also used. In addition, the portoflio uses top picks from our Forecast Model. In essence, the portfolio is constructed with the best picks from our main propiretary models

Each month you will receive an electronic copy of our newsletter highlighting 15 potential long positions along with five alternate picks. Our investment strategies focus on dozens of fundamental and technical factors for over 8000 individual stocks, synthesize the data, and then come up with a portfolio. Each newsletter portfolio focuses on maximum potential returns so there are no diversity requirements. Each portfolio pick includes critical ValuEngine valuation and forecast data. These 20 total picks represent the most up-to-date equity assessments of our proprietary models.

Please click HERE to subscribe. You may download a sample copy HERE. After your subscription is approved, you will immediately receive access to download the current issue of newsletter as well as the previous issues, which are all available as PDF files. Each month when the latest issue of the newsletter is released, we will send you an email, informing you to download it from the site. The newsletter is released near the middle of each month.


  VE View vs. S&P 500 Index Past Five Years
VE View
S&P 500
Ann Return
21.67%
13.60%
Ann Volatility
22.28%
12.38%
Sharpe Ratio
0.97
1.10
Sortino Ratio
1.67
1.46
Max Drawdown
-34.94% -11.14%

  The ValuEngine View Newsletter is derived from the ValuEngine Aggressive and Diversified Growth Benchmark
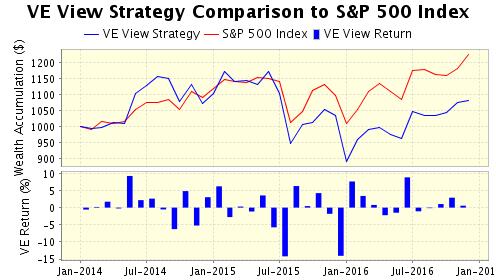
Portfolio Strategies. These strategies are the product of ValuEngine's academic research team and combine cutting-edge financial analysis and portfolio construction techniques with real-world Wall St. know how. 

CLICK HERE to Subscribe to the ValuEngine View

The ValuEngine View Newsletter portfolio has 15 primary stock picks and five alternates and is re-balanced once each month. The ValuEngine View Newsletter is published near the middle of each calendar month. An equal amount of capital is allocated to each stock. The monthly returns are calculated from the closing prices on date of publication. The performance calculation does not include any transaction costs.

ValuEngine Market Overview

Summary of VE Stock Universe
Stocks Undervalued
34.2%
Stocks Overvalued
65.8%
Stocks Undervalued by 20%
12.74%
Stocks Overvalued by 20%
28.29%

ValuEngine Sector Overview

Sector
Change
MTD
YTD
Valuation
Last 12-MReturn
P/E Ratio
-0.68%
2.64%
15.88%
23.81% overvalued
18.48%
30.80
-0.32%
2.13%
7.18%
19.93% overvalued
-4.26%
22.74
-0.83%
0.70%
7.98%
16.33% overvalued
7.15%
30.81
-0.84%
1.91%
5.99%
15.79% overvalued
3.42%
25.52
-0.50%
1.24%
2.60%
14.61% overvalued
8.73%
26.21
-0.64%
1.09%
10.07%
14.33% overvalued
0.34%
27.90
-0.90%
1.80%
4.84%
14.05% overvalued
3.23%
24.60
-0.32%
-0.74%
2.29%
13.45% overvalued
0.55%
22.81
-0.38%
1.72%
5.01%
9.23% overvalued
3.49%
17.85
-0.49%
-1.46%
-0.42%
7.58% overvalued
-34.68%
24.42
-0.92%
-1.04%
3.59%
5.65% overvalued
-4.71%
16.85
-0.37%
0.87%
4.70%
5.51% overvalued
-4.91%
20.74
-1.04%
-0.75%
0.57%
4.45% overvalued
1.05%
18.43
0.47%
0.92%
3.17%
4.00% overvalued
1.17%
24.91
-0.54%
-0.70%
1.41%
3.24% overvalued
-5.43%
21.75
-0.29%
-1.44%
0.56%
1.90% overvalued
-15.68%
24.81


ValuEngine.com Products and Services


With the ValuEngine Forecast 16 Market Neutral Strategy Portfolio Newsletter, you can run your own portfolio like a hedge fund to manage risk and profit in any market environment.
With ValuEngine.com's Premium Website Membership you get forecasts, valuations, and recommendations on more than 7,000 stocks updated every trading day! 
NO OBLIGATION, 14-DAY FREE TRIAL!


Close this window
ValuEngine.com - Rational advice, smarter investing.