September 10, 2015
ATTENTION
Advanced Investors and Finance Professionals:
If you are reading this you should subscribe to the ValuEngine Professional Service to see how VE’s powerful quantitative
tools can increase your productivity and effectiveness. |
VALUATION WATCH: Overvalued stocks now make up 39.26% of our stocks assigned a valuation and 12.77% of those equities are calculated to be overvalued by 20% or more. Three sectors are calculated to be overvalued--with one at-or-near double digits.
--If You Cannot Beat Them, Buy Them
Miller Coors Buys Craft Brewer
Molson Coors Brewing Company (TAP) is the world's fifth-largest global brewer. Molson Coors Brewing Company has 15,000 employees worldwide, 18 breweries, and a broad portfolio of over 40 brands, including Molson Canadian, Coors Light and Carling.
SABMILLER PLC (SBMRY) is one of the world's largest brewers with brewing interests or distribution agreements in over sixty countries across six continents. The principal activities of the Company and its subsidiaries are the manufacture, distribution and sale of beverages. The group's brands include premium international beers such as Grolsch, Miller Genuine Draft, Peroni Nastro Azzurro and Pilsner Urquell, as well as an exceptional range of market leading local brands. Outside the USA, SABMiller plc is also one of the largest bottlers of Coca-Cola products in the world.
Together these two giants form MillerCoors LLC and they are the latest macro brewer to enter the craft beer market NOT by making better beer on their own, but via an acquisition. The firms announced today that they had acquired Saint Archer Brewing, San Diego, California. Saint Archer produces @35000 bbl/year.
This purchase comes on the heels of another high-profile acquisition as Heineken also announced this week that it was purchasing a 50% portion of famed craft brewer Lagunitas.
Macro brewers remain stymied by the better craft beers, and keep losing market share to the far more numerous competitors. Miller Coors hopes that they can have an easier time of penetrating the market by pushing the popular Saint Archer IPA across the US.
These sorts of arrangements pose a conundrum for craft beer aficionados as drinkers want to try quality beers from across the nation, but are reticent to do so once the craft brand is "tainted" by its association with a big macro brewer. MillerCoors promises that Saint Archer will remain independent, and just "benefit" from large-sale distribution and sales resources. But, often that doesn't pass muster with the notoriously picky craft drinkers.
Meanwhile the big boys continue to claim craft cannot continue to expand, that "real men" drink weak American lagers such as Budweiser and Coors, and that
many of the upstarts will soon go under. So far, that has not been the case, and mocking craft beer drinkers via Super Bowl ads and other means has been a colossal waste of resources which would be better spent on ingredients and some better brews.
Below, we present the latest top-ten list of major beer brewing/beverage stocks from our models. They are ranked according to their one-month forecast return figures. Members can always screen for these stocks using our advanced screening page HERE or our industry valuation page HERE.
Ticker |
Company Name |
Market Price |
Valuation |
Last 12-M Return |
1-M Forecast Return |
1-Yr Forecast Return |
P/E Ratio |
Sector Name |
KNBWY |
KIRIN HLDGS CO |
13.81 |
N/A |
4.46% |
0.13% |
1.51% |
N/A |
Consumer Staples |
CCU |
CERV UNIDAS-ADR |
20.99 |
-11.31% |
-5.71% |
0.12% |
1.49% |
18.23 |
Consumer Staples |
BUD |
ANHEUSER-BU ADR |
108.06 |
-6.11% |
-3.07% |
0.07% |
0.82% |
19.76 |
Consumer Staples |
HEINY |
HEINEKEN NV |
39.015 |
N/A |
0.87% |
0.06% |
0.74% |
N/A |
Consumer Staples |
SAM |
BOSTON BEER INC |
213.34 |
-17.36% |
-1.09% |
0.01% |
0.15% |
29.41 |
Consumer Staples |
DEO |
DIAGEO PLC-ADR |
105.95 |
N/A |
-11.57% |
-0.06% |
-0.72% |
18.29 |
Consumer Staples |
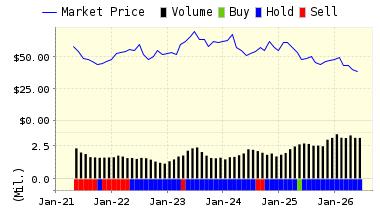
TAP |
MOLSON COORS-B |
68.44 |
25.92% |
-2.49% |
-0.06% |
-0.75% |
18.04 |
Consumer Staples |
ABEV |
AMBEV-PR ADR |
5.03 |
-15.86% |
-26.35% |
-0.11% |
-1.27% |
17.34 |
Consumer Staples |
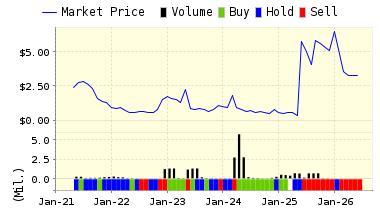
SBMRY |
SABMILLER PLC |
46.25 |
N/A |
-17.73% |
-0.17% |
-2.06% |
19.21 |
Consumer Staples |
CABGY |
CARLSBERG A/S |
14.96 |
N/A |
-19.72% |
-0.27% |
-3.19% |
N/A |
Consumer Staples |
Below is today's data on TAP and SBMRY:
TAP: ValuEngine continues its HOLD recommendation on MOLSON COORS-B for 2015-09-09. Based on the information we have gathered and our resulting research, we feel that MOLSON COORS-B has the probability to ROUGHLY MATCH average market performance for the next year. The company exhibits ATTRACTIVE Company Size but UNATTRACTIVE Book Market Ratio.
NOTE: You may also download a free copy of detailed report on TAP from the link below.
ValuEngine Forecast |
| |
Target
Price* |
Expected
Return |
1-Month |
68.40 |
-0.06% |
3-Month |
70.13 |
2.47% |
6-Month |
72.59 |
6.06% |
1-Year |
67.93 |
-0.75% |
2-Year |
84.67 |
23.72% |
3-Year |
77.09 |
12.64% |
Valuation & Rankings |
Valuation |
25.92% overvalued |
|
 10 10 |
1-M Forecast Return |
-0.06% |
1-M Forecast Return Rank |
46 |
12-M Return |
-2.49% |
|
63 |
Sharpe Ratio |
0.49 |
|
80 |
5-Y Avg Annual Return |
8.93% |
5-Y Avg Annual Rtn Rank |
72 |
Volatility |
18.10% |
|
78 |
Expected EPS Growth |
3.08% |
|
29 |
Market Cap (billions) |
11.29 |
Size Rank |
91 |
Trailing P/E Ratio |
18.04 |
|
61 |
Forward P/E Ratio |
17.50 |
Forward P/E Ratio Rank |
38 |
PEG Ratio |
5.87 |
PEG Ratio Rank |
6 |
Price/Sales |
2.94 |
|
31 |
Market/Book |
79.08 |
|
2 |
Beta |
1.00 |
Beta Rank |
45 |
Alpha |
-0.07 |
Alpha Rank |
46 |
SBMRY: ValuEngine continues its HOLD recommendation on SABMILLER PLC for 2015-09-09. Based on the information we have gathered and our resulting research, we feel that SABMILLER PLC has the probability to ROUGHLY MATCH average market performance for the next year. The company exhibits ATTRACTIVE Company Size but UNATTRACTIVE Book Market Ratio.

ValuEngine Forecast |
| |
Target
Price* |
Expected
Return |
1-Month |
46.17 |
-0.17% |
3-Month |
46.47 |
0.47% |
6-Month |
46.82 |
1.23% |
1-Year |
45.30 |
-2.06% |
2-Year |
47.91 |
3.58% |
3-Year |
50.66 |
9.54% |
Valuation & Rankings |
Valuation |
n/a |
|
n/a |
1-M Forecast Return |
-0.17% |
1-M Forecast Return Rank |
37 |
12-M Return |
-17.73% |
|
43 |
Sharpe Ratio |
0.49 |
|
80 |
5-Y Avg Annual Return |
10.06% |
5-Y Avg Annual Rtn Rank |
74 |
Volatility |
20.46% |
|
74 |
Expected EPS Growth |
9.97% |
|
43 |
Market Cap (billions) |
74.60 |
Size Rank |
99 |
Trailing P/E Ratio |
19.21 |
|
57 |
Forward P/E Ratio |
17.47 |
Forward P/E Ratio Rank |
38 |
PEG Ratio |
1.93 |
PEG Ratio Rank |
21 |
Price/Sales |
n/a |
|
n/a |
Market/Book |
45.71 |
|
3 |
Beta |
1.25 |
Beta Rank |
32 |
Alpha |
-0.14 |
Alpha Rank |
38 |
ValuEngine.com is an independent research provider, producing buy/hold/sell recommendations, target price, and valuations on over 7,000 US and Canadian equities every trading day.
Visit our website for more information and a free trial.
Our individual company, industry, and sector reports offer individual investors and professionals the information they need to make informed decisions about investment prospects in an actionable format. They are objective, timely, and--most importantly--available, for more than 4000 US and more than 1200 Canadian companies.
CLICK HERE TO SEARCH OUR REPORT DATABASE
ValuEngine Stock Reports are Objective, Un-Biased, and Updated Every Trading Day!
With ValuEngine's Redesigned Stock Reports, you get our up-to-the minute Buy/Sell/Hold recommendations on over 5000 US and Canadian stocks, complete valuation and forecast data, company financials, and much, much more.
We have added new sections to the reports. These include consensus analysts estimates, historical rating-change data, and more. This info is presented along with other critical company information so you can drill down into the company's fundamentals and cut through the hype to get a real picture of the profit potential--or lack thereof-- for the more than 5000 company tickers we cover and update EVERY TRADING DAY!
ValuEngine Stock Reports give you access to the most critical ValuEngine data points--including valuation and forecast figures from our proprietary models. They provide everything you need to make the VE Stock Evaluation Models work
for you, and they can substantially increase your chances of success in the
Market.
ValuEngine's Stock Reports Provide Everything You Need to Evaluate a Company BEFORE You Invest

DOWNLOAD A FREE SAMPLE OF OUR TAP REPORT BY CLICKING THE REPORT IMAGE --->
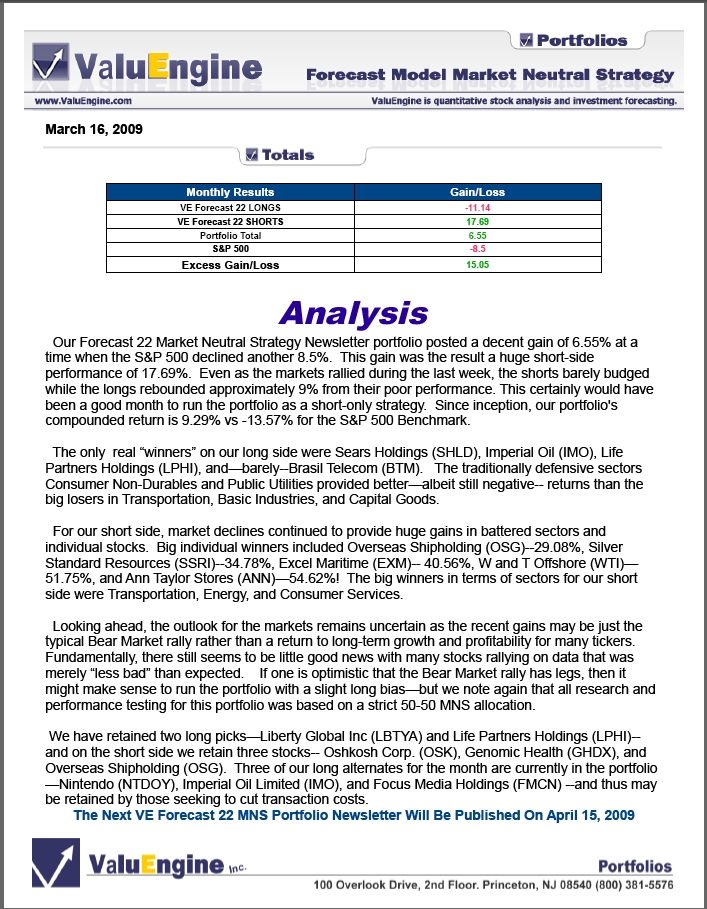
Want To Know More About Our ValuEngine View Newsletter?
Looking for a monthly portfolio of stock picks which are objective and based on cutting-edge academic theory and Wall St.practice? Then subscribe to The ValuEngine View Newsletter.The ValuEngine View Portfolio is based on our highly-refined and tested ValuEngine Portfolio Strategies along with our proprietary quant-based composite scoring system. The ValuEngine View Newsletter is the product of sophisticated stock valuation and forecast models first developed by Yale Professor of Finance Zhiwu Chen.
The ValuEngine View Newsletter is the product of a sophisticated stock valuation model that was first developed by ValuEngine's academic research team. It utilizes a three factor approach: fundamental variables such as a company's trailing 12-month Earnings-Per-Share (EPS), the analyst consensus estimate of the company's future 12-month EPS, and the 30-year Treasury yield are all used to create a more accurate reflection of a company's fair value. A total of eleven additional firm specific variables are also used. In addition, the portoflio uses top picks from our Forecast Model. In essence, the portfolio is constructed with the best picks from our main propiretary models
Each month you will receive an electronic copy of our newsletter highlighting 15 potential long positions along with five alternate picks. Our investment strategies focus on dozens of fundamental and technical factors for over 8000 individual stocks, synthesize the data, and then come up with a portfolio. Each newsletter portfolio focuses on maximum potential returns so there are no diversity requirements. Each portfolio pick includes critical ValuEngine valuation and forecast data. These 20 total picks represent the most up-to-date equity assessments of our proprietary models.
Please click HERE to subscribe. You may download a sample copy HERE. After your subscription is approved, you will immediately receive access to download the current issue of newsletter as well as the previous issues, which are all available as PDF files. Each month when the latest issue of the newsletter is released, we will send you an email, informing you to download it from the site. The newsletter is released near the middle of each month.
VE View vs. S&P 500 Index Past Five Years |
|
VE View |
S&P 500 |
Ann Return |
19.75% |
14.13% |
Ann Volatility |
21.06% |
11.13% |
Sharpe Ratio |
0.94 |
1.27 |
Sortino Ratio |
1.55 |
1.56 |
Max Drawdown |
-34.94% |
-11.14% |
The ValuEngine View Newsletter is derived from the ValuEngine Aggressive and Diversified Growth Benchmark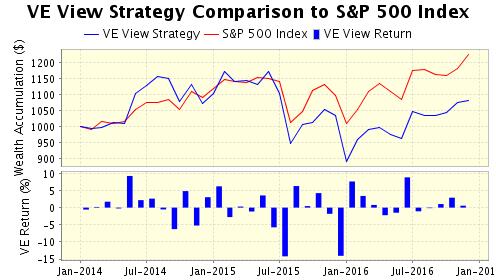 Portfolio Strategies. These strategies are the product of ValuEngine's academic research team and combine cutting-edge financial analysis and portfolio construction techniques with real-world Wall St. know how. Portfolio Strategies. These strategies are the product of ValuEngine's academic research team and combine cutting-edge financial analysis and portfolio construction techniques with real-world Wall St. know how.
CLICK HERE to Subscribe to the ValuEngine View
The ValuEngine View Newsletter portfolio has 15 primary stock picks and five alternates and is re-balanced once each month. The ValuEngine View Newsletter is published near the middle of each calendar month. An equal amount of capital is allocated to each stock. The monthly returns are calculated from the closing prices on date of publication. The performance calculation does not include any transaction costs.
ValuEngine Market Overview
Summary of VE Stock Universe |
Stocks Undervalued |
60.74% |
Stocks Overvalued |
39.26% |
Stocks Undervalued by 20% |
24.5% |
Stocks Overvalued by 20% |
12.77% |
ValuEngine Sector Overview
|
|
|
|
|
|
|
|
-0.18% |
-0.09% |
-2.72% |
9.74% overvalued |
-7.15% |
18.06 |
|
-0.86% |
0.12% |
8.65% |
6.83% overvalued |
8.19% |
31.66 |
|
-1.05% |
-0.77% |
-4.84% |
0.48% overvalued |
-5.06% |
23.15 |
|
-0.65% |
-0.63% |
-1.73% |
0.24% undervalued |
-5.36% |
22.28 |
|
-0.72% |
-0.90% |
1.34% |
0.37% undervalued |
-6.02% |
26.30 |
|
-0.67% |
0.45% |
-5.76% |
1.38% undervalued |
-1.48% |
22.93 |
|
-0.05% |
-1.22% |
-8.93% |
2.09% undervalued |
-4.16% |
20.90 |
|
-0.79% |
-0.45% |
-3.90% |
2.44% undervalued |
-7.03% |
28.19 |
|
-0.51% |
-1.06% |
-2.98% |
2.84% undervalued |
-5.22% |
16.47 |
|
-0.45% |
0.35% |
3.05% |
3.17% undervalued |
-3.54% |
22.10 |
|
-0.49% |
-0.83% |
-7.68% |
5.96% undervalued |
-12.15% |
21.15 |
|
-0.48% |
-0.67% |
-8.83% |
8.79% undervalued |
-13.71% |
14.75 |
|
-0.26% |
-0.98% |
-7.57% |
9.54% undervalued |
-14.07% |
18.42 |
|
-0.82% |
-1.52% |
-12.36% |
11.24% undervalued |
-15.28% |
15.52 |
|
-2.12% |
-5.61% |
-19.43% |
13.59% undervalued |
-49.85% |
25.13 |
|
-0.64% |
-1.98% |
-15.72% |
16.31% undervalued |
-34.13% |
20.28 |
ValuEngine.com Products and Services
With VE's Premium Professional Service, Financial Professionals and Sophisticated Individual Investors Get Complete Access to ALL of ValuEngine's Investment Tools |
|
|
With ValuEngine.com's Premium Website Membership you get forecasts, valuations, and recommendations on more than 7,000 stocks updated every trading day!
NO OBLIGATION, 14-DAY FREE TRIAL! |
|
 |

|