November 16, 2015
VALUATION WATCH: Overvalued stocks now make up 45.25% of our stocks assigned a valuation and 15.91% of those equities are calculated to be overvalued by 20% or more. Six sectors are calculated to be overvalued--with one near double digits.
Upgrade
--ValuEngine Top-Five UPGRADES for the Day
ValuEngine tracks more than 7000 US equities, ADRs, and foreign stock which trade on US exchanges as well as @1000 Canadian equities. When EPS estimates are available for a given equity, our model calculates a level of mispricing or valuation percentage for that equity based on earnings estimates and what the stock should be worth if the market were totally rational and efficient--an academic exercise to be sure, but one which allows for useful comparisons between equities, sectors, and industries. Using our Valuation Model, we can currently assign a VE valuation calculation to more than 2800 stocks in our US Universe.
We also use trading data to provide forecast estimates for a variety of time horizons for almost ever equity in our database. Our Buy/Sell/Hold recommendations are based upon the 1-year forecast return figure. Using valuation and forecast figures, you can rank and rate our covered stocks against each other, to find out, in an objective and systematic way, the most attractive investment targets based on your own risk/reward parameters. We re-calculate the entire database every trading day, so you are assured that every proprietary valuation and forecast datapoint is as up-to-date as possible.
Below, we present the latest top-five list of UPGRADED stocks from our models. They are presented according to their one-month forecast return figures. Appollo Commercial Real Estate Finance REIT is today's leader in terms of overall forecast predictions.
Ticker |
Company Name |
Market Price |
Valuation |
Last 12-M Return |
1-M Forecast Return |
1-Yr Forecast Return |
P/E Ratio |
Sector Name |
ARI |
APOLLO COMMERCL |
16.99 |
-1.29% |
3.35% |
1.09% |
13.08% |
9.12 |
Finance |
CFI |
CULP INC |
25.98 |
-5.02% |
36.95% |
1.09% |
13.07% |
14.85 |
Consumer Discretionary |
TDCB |
THIRD CENTRY BC |
8.75 |
N/A |
15.13% |
0.53% |
6.39% |
N/A |
Finance |
ITIC |
INVESTORS TITLE |
81.29 |
N/A |
9.08% |
0.52% |
6.23% |
N/A |
Finance |
WSTG |
WAYSIDE TECH GP |
18.22 |
N/A |
5.62% |
0.52% |
6.18% |
N/A |
Retail-Wholesale |
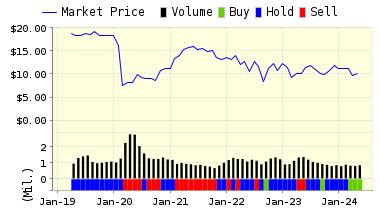
Below is today's data on Apollo Commercial Real Estate Finance (ARI):
Apollo Commercial Real Estate Finance, Inc. is focused on investing in, acquiring and managing senior performing commercial real estate mortgage loans, commercial mortgage-backed securities, commercial real estate corporate debt and loans, and other real estate debt investments. The Company is a commercial real estate finance company that is managed and advised by ACREFI Management, LLC, a indirect subsidiary of Apollo Global Management, LLC.
VALUENGINE RECOMMENDATION: ValuEngine updated its recommendation from BUY to STRONG BUY for APOLLO COMMERCL on 2015-11-13. Based on the information we have gathered and our resulting research, we feel that APOLLO COMMERCL has the probability to OUTPERFORM average market performance for the next year. The company exhibits ATTRACTIVE P/E Ratio and Volatility.
You can download a free copy of detailed report on ARI from the link below.
ValuEngine Forecast |
| |
Target
Price* |
Expected
Return |
1-Month |
17.17 |
1.09% |
3-Month |
17.51 |
3.07% |
6-Month |
17.80 |
4.77% |
1-Year |
19.21 |
13.08% |
2-Year |
18.45 |
8.58% |
3-Year |
18.90 |
11.26% |
Valuation & Rankings |
Valuation |
1.29% undervalued |
|
 48 48 |
1-M Forecast Return |
1.09% |
1-M Forecast Return Rank |
98 |
12-M Return |
3.35% |
|
70 |
Sharpe Ratio |
0.03 |
|
59 |
5-Y Avg Annual Return |
0.39% |
5-Y Avg Annual Rtn Rank |
58 |
Volatility |
13.67% |
|
87 |
Expected EPS Growth |
-1.07% |
|
24 |
Market Cap (billions) |
0.80 |
Size Rank |
63 |
Trailing P/E Ratio |
9.12 |
|
92 |
Forward P/E Ratio |
9.22 |
Forward P/E Ratio Rank |
84 |
PEG Ratio |
n/a |
PEG Ratio Rank |
n/a |
Price/Sales |
6.26 |
|
14 |
Market/Book |
0.76 |
|
82 |
Beta |
0.73 |
Beta Rank |
57 |
Alpha |
-0.01 |
Alpha Rank |
57 |

DOWNLOAD A FREE SAMPLE OF OUR APOLLO COMMERCIAL REAL ESTATE (ARI) REPORT BY CLICKING HERE
(LINK FIXED)
ValuEngine Market Overview
Summary of VE Stock Universe |
Stocks Undervalued |
54.75% |
Stocks Overvalued |
45.25% |
Stocks Undervalued by 20% |
24.99% |
Stocks Overvalued by 20% |
15.91% |
ValuEngine Sector Overview
|
|
|
|
|
|
|
|
-0.49% |
-2.45% |
-1.84% |
9.58% overvalued |
-10.38% |
17.61 |
|
-0.76% |
-3.18% |
4.81% |
3.81% overvalued |
-0.44% |
23.84 |
|
-1.19% |
-3.41% |
-2.00% |
3.57% overvalued |
-3.42% |
23.66 |
|
0.24% |
0.18% |
2.16% |
2.37% overvalued |
2.07% |
27.86 |
|
-0.81% |
-1.33% |
0.00% |
2.09% overvalued |
-3.88% |
16.87 |
|
-1.10% |
-1.27% |
-0.72% |
1.61% overvalued |
-2.35% |
27.36 |
|
-0.85% |
-4.60% |
-7.68% |
0.27% undervalued |
-10.68% |
20.79 |
|
-1.55% |
-3.44% |
-0.86% |
0.59% undervalued |
-3.90% |
24.77 |
|
-1.22% |
-1.81% |
-9.67% |
0.96% undervalued |
-10.13% |
17.59 |
|
0.22% |
-2.29% |
-8.55% |
4.44% undervalued |
-13.27% |
19.53 |
|
-0.38% |
-0.99% |
1.77% |
5.20% undervalued |
-4.22% |
20.03 |
|
-0.08% |
-5.06% |
-23.76% |
8.30% undervalued |
-44.36% |
24.98 |
|
-1.06% |
-2.22% |
-6.24% |
8.71% undervalued |
-8.47% |
13.45 |
|
-2.72% |
-3.96% |
-10.25% |
8.82% undervalued |
-6.25% |
20.86 |
|
-0.05% |
-2.69% |
-13.41% |
12.90% undervalued |
-17.46% |
15.20 |
|
-0.05% |
-4.09% |
-17.76% |
13.38% undervalued |
-22.02% |
23.07 |
ValuEngine.com is an independent research provider, producing buy/hold/sell recommendations, target price, and valuations on over 7,000 US and Canadian equities every trading day.
Visit www.ValuEngine.com for more information

|


