November 17, 2015
VALUATION WATCH: Overvalued stocks now make up 47.59% of our stocks assigned a valuation and 14.98% of those equities are calculated to be overvalued by 20% or more. Nine sectors are calculated to be overvalued--one by double digits.
No Place Like Home
--Home Depot Results Show Strong Sales Boost
We had some impressive results from home improvement super store Home Depot today, with the company reporting a 6.4% increase in sales vs Q3 2014 as well as an increase in net earnings of $0.20/share. These figures include the costs associated with that massive customer data breach last year as well.
These numbers may be used to argue that the US housing market is well into recovery as Home Depot chairman, CEO and president Craig Menear noted that "during the quarter, we saw broad-based growth across our geographies and product categories, led by growth in transactions from both our DIY and Pro customers." This
sort of growth has NOT shown up at retailers in other categories and indicates that people are focusing on their homes rather than clothing, electronics, etc.
With the good results this quarter, Home Depot updated its guidance. "Based on its year-to-date results and the outlook for the fourth quarter, the Company expects fiscal 2015 sales growth of approximately 5.7 percent, with comps of approximately 4.9 percent. The Company also expects fiscal 2015 diluted earnings per share to grow by approximately 14 percent to $5.36. "
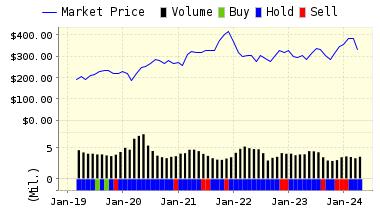
Below is today's data on Home Depot:
Home Depot (HD) is the one of world's largest home improvement retailer. The company offers a level of service unprecedented among warehouse-style retailers. Home Depot stores cater to do-it-yourselfers, as well as home improvement, construction and building maintenance professionals. The Home Depot currently operates in the USA, Canada, Chile, Puerto Rico, and Argentina. The company also operates EXPO Design Centers across the U.S. and Villager's Hardware in New Jersey.
VALUENGINE RECOMMENDATION: ValuEngine continues its HOLD recommendation on HOME DEPOT for 2015-11-16. Based on the information we have gathered and our resulting research, we feel that HOME DEPOT has the probability to ROUGHLY MATCH average market performance for the next year. The company exhibits ATTRACTIVE Company Size but UNATTRACTIVE Book Market Ratio.
You can download a free copy of detailed report on HD from the link below.
ValuEngine Forecast |
| |
Target
Price* |
Expected
Return |
1-Month |
121.11 |
0.22% |
3-Month |
122.06 |
1.01% |
6-Month |
123.32 |
2.05% |
1-Year |
124.09 |
2.69% |
2-Year |
134.95 |
11.67% |
3-Year |
124.02 |
2.63% |
Valuation & Rankings |
Valuation |
7.82% overvalued |
|
 34 34 |
1-M Forecast Return |
0.22% |
1-M Forecast Return Rank |
68 |
12-M Return |
23.91% |
|
86 |
Sharpe Ratio |
1.66 |
|
100 |
5-Y Avg Annual Return |
27.73% |
5-Y Avg Annual Rtn Rank |
96 |
Volatility |
16.67% |
|
81 |
Expected EPS Growth |
15.22% |
|
54 |
Market Cap (billions) |
159.25 |
Size Rank |
100 |
Trailing P/E Ratio |
23.28 |
|
50 |
Forward P/E Ratio |
20.21 |
Forward P/E Ratio Rank |
28 |
PEG Ratio |
1.53 |
PEG Ratio Rank |
32 |
Price/Sales |
1.86 |
|
46 |
Market/Book |
21.82 |
|
5 |
Beta |
0.95 |
Beta Rank |
45 |
Alpha |
0.21 |
Alpha Rank |
87 |

DOWNLOAD A FREE SAMPLE OF OUR HOME DEPOT (HD) REPORT BY CLICKING HERE
(LINK FIXED)
ValuEngine Market Overview
Summary of VE Stock Universe |
Stocks Undervalued |
52.41% |
Stocks Overvalued |
47.59% |
Stocks Undervalued by 20% |
23.79% |
Stocks Overvalued by 20% |
17.11% |
ValuEngine Sector Overview
|
|
|
|
|
|
|
|
1.86% |
-0.55% |
-0.13% |
12.54% overvalued |
-8.77% |
18.12 |
|
0.55% |
-2.86% |
-1.37% |
5.19% overvalued |
-3.51% |
23.91 |
|
0.36% |
-2.75% |
4.85% |
5.01% overvalued |
-0.12% |
24.01 |
|
0.62% |
-0.62% |
0.63% |
3.16% overvalued |
-3.39% |
16.93 |
|
0.38% |
-0.67% |
-0.09% |
2.65% overvalued |
-1.94% |
27.62 |
|
-0.06% |
0.08% |
2.38% |
2.23% overvalued |
1.70% |
27.97 |
|
1.26% |
-3.48% |
-6.79% |
1.59% overvalued |
-9.65% |
21.30 |
|
0.87% |
-0.86% |
-8.69% |
0.30% overvalued |
-8.95% |
17.73 |
|
0.50% |
-2.96% |
-0.37% |
0.07% overvalued |
-3.30% |
24.81 |
|
1.11% |
0.33% |
2.78% |
3.16% undervalued |
-3.11% |
20.38 |
|
0.82% |
-1.37% |
-7.48% |
3.55% undervalued |
-12.12% |
19.71 |
|
1.84% |
-3.10% |
-22.45% |
6.23% undervalued |
-43.66% |
25.44 |
|
0.79% |
-3.05% |
-9.38% |
7.78% undervalued |
-5.78% |
21.09 |
|
0.62% |
-1.58% |
-5.69% |
7.81% undervalued |
-7.76% |
13.53 |
|
0.28% |
-2.34% |
-13.12% |
12.48% undervalued |
-17.29% |
15.22 |
|
0.24% |
-3.75% |
-17.90% |
12.67% undervalued |
-22.02% |
23.12 |
ValuEngine.com is an independent research provider, producing buy/hold/sell recommendations, target price, and valuations on over 7,000 US and Canadian equities every trading day.
Visit www.ValuEngine.com for more information

|


