December 2, 2015
VALUATION WATCH: Overvalued stocks now make up 42.78% of our stocks assigned a valuation and 14.74% of those equities are calculated to be overvalued by 20% or more. Five sectors are calculated to be overvalued.
Indexing
--ValuEngine Rates and Ranks the DOW
ValuEngine tracks more than 7000 US equities, ADRs, and foreign stock which trade on US exchanges as well as @1000 Canadian equities. When EPS estimates are available for a given equity, our model calculates a level of mispricing or valuation percentage for that equity based on earnings estimates and what the stock should be worth if the market were totally rational and efficient--an academic exercise to be sure, but one which allows for useful comparisons between equities, sectors, and industries. Using our Valuation Model, we can currently assign a VE valuation calculation to more than 2800 stocks in our US Universe.
We also use trading data to provide forecast estimates for a variety of time horizons for almost ever equity in our database. Our Buy/Sell/Hold recommendations are based upon the 1-year forecast return figure. Using valuation and forecast figures, you can rank and rate our covered stocks against each other, to find out, in an objective and systematic way, the most attractive investment targets based on your own risk/reward parameters. We re-calculate the entire database every trading day, so you are assured that every proprietary valuation and forecast datapoint is as up-to-date as possible.
We can use our data to track individual stocks, industries, sectors, and indices. For today's bulletin, we present key metrics for the top picks in the Dow Jones Industrials. The companies listed below represent the top buy-rated stocks within the index. They are presented below according to their one-month forecast gain.
Traveler's Insurance is the overall leader. The components of this list are little changed since the last time we presented the top Dow picks a month ago.
Ticker |
Company Name |
Market Price |
Valuation |
Last 12-M Retrn |
1-M Forecast Retn |
1-Yr Forecast Retn |
P/E Ratio |
Sector Name |
TRV |
TRAVELERS COS |
111.04 |
3.48% |
5.73% |
1.01% |
12.09% |
10.30 |
Finance |
AAPL |
APPLE INC |
115.62 |
-7.55% |
1.31% |
0.85% |
10.18% |
12.39 |
Computer and Technology |
JPM |
JPMORGAN CHASE |
65.46 |
10.80% |
4.82% |
0.81% |
9.70% |
11.73 |
Finance |
VZ |
VERIZON COMM |
45.36 |
-8.23% |
-3.32% |
0.75% |
9.02% |
11.56 |
Utilities |
GS |
GOLDMAN SACHS |
180.71 |
-7.74% |
-8.22% |
0.69% |
8.28% |
9.93 |
Finance |
IBM |
INTL BUS MACH |
136.61 |
-23.61% |
-16.19% |
0.69% |
8.26% |
8.98 |
Computer and Technology |
CSCO |
CISCO SYSTEMS |
26.73 |
-2.48% |
-2.52% |
0.58% |
6.95% |
13.10 |
Computer and Technology |
BA |
BOEING CO |
144.24 |
0.02% |
11.24% |
0.53% |
6.39% |
17.39 |
Aerospace |
PFE |
PFIZER INC |
32.29 |
14.15% |
1.06% |
0.42% |
5.02% |
14.74 |
Medical |
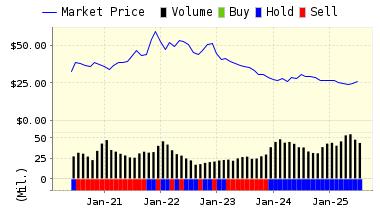
Below is today's data on Pfizer Inc. (PFE):
Pfizer Inc. is a research-based, global pharmaceutical company that discovers, develops, manufactures, and markets medicines for humans and animals. The Company's diversified global healthcare portfolio includes human and animal biologic and small molecule medicines and vaccines, as well as nutritional products and consumer healthcare products. Pfizer's Animal Health business unit discovers, develops and sells products for the prevention and treatment of diseases in livestock and companion animals. It sells its products to wholesalers, distributors, retailers, hospitals, clinics, government agencies, pharmacies, individual provider offices, veterinarians, livestock producers, and grocery and convenience stores. Pfizer Inc. is headquartered in New York.
VALUENGINE RECOMMENDATION: ValuEngine continues its BUY recommendation on PFIZER INC for 2015-12-09. Based on the information we have gathered and our resulting research, we feel that PFIZER INC has the probability to OUTPERFORM average market performance for the next year. The company exhibits ATTRACTIVE Company Size and Sharpe Ratio.
You can download a free copy of detailed report on PFE from the link below.
ValuEngine Forecast |
| |
Target
Price* |
Expected
Return |
1-Month |
32.43 |
0.42% |
3-Month |
33.10 |
2.51% |
6-Month |
34.29 |
6.21% |
1-Year |
33.91 |
5.02% |
2-Year |
38.69 |
19.82% |
3-Year |
42.38 |
31.26% |
Valuation & Rankings |
Valuation |
14.15% overvalued |
|
 21 21 |
1-M Forecast Return |
0.42% |
1-M Forecast Return Rank |
81 |
12-M Return |
1.06% |
|
68 |
Sharpe Ratio |
0.90 |
|
94 |
5-Y Avg Annual Return |
13.97% |
5-Y Avg Annual Rtn Rank |
84 |
Volatility |
15.47% |
|
83 |
Expected EPS Growth |
10.81% |
|
44 |
Market Cap (billions) |
203.45 |
Size Rank |
100 |
Trailing P/E Ratio |
14.74 |
|
74 |
Forward P/E Ratio |
13.31 |
Forward P/E Ratio Rank |
61 |
PEG Ratio |
1.36 |
PEG Ratio Rank |
34 |
Price/Sales |
4.25 |
|
21 |
Market/Book |
3.03 |
|
36 |
Beta |
0.90 |
Beta Rank |
48 |
Alpha |
0.05 |
Alpha Rank |
71 |

DOWNLOAD A FREE SAMPLE OF OUR PFIZER (PFE) REPORT BY CLICKING HERE
(LINK FIXED)
ValuEngine Market Overview
Summary of VE Stock Universe |
Stocks Undervalued |
57.22% |
Stocks Overvalued |
42.78% |
Stocks Undervalued by 20% |
26.99% |
Stocks Overvalued by 20% |
14.74% |
ValuEngine Sector Overview
|
|
|
|
|
|
|
|
-0.72% |
-1.13% |
5.34% |
6.19% overvalued |
-0.51% |
23.49 |
|
-0.81% |
-2.53% |
-1.98% |
2.30% overvalued |
-4.99% |
24.74 |
|
-1.77% |
-3.20% |
0.56% |
1.87% overvalued |
-2.06% |
28.11 |
|
-0.20% |
-3.20% |
-12.23% |
1.43% overvalued |
-11.99% |
16.88 |
|
-1.28% |
-3.58% |
1.70% |
0.69% overvalued |
-1.65% |
27.93 |
|
-0.77% |
-3.00% |
0.20% |
0.88% undervalued |
-4.49% |
16.03 |
|
-1.16% |
-3.60% |
-0.01% |
1.08% undervalued |
-5.75% |
22.39 |
|
-1.26% |
-4.46% |
-1.09% |
2.98% undervalued |
-6.33% |
20.28 |
|
-0.68% |
-2.45% |
-1.00% |
3.69% undervalued |
-3.05% |
24.70 |
|
-0.37% |
-3.30% |
-8.69% |
4.04% undervalued |
-10.18% |
21.62 |
|
-0.21% |
-4.39% |
-9.39% |
5.85% undervalued |
-11.50% |
18.22 |
|
-0.50% |
-2.01% |
-8.64% |
6.63% undervalued |
-6.55% |
23.40 |
|
-0.02% |
-4.43% |
-7.83% |
11.23% undervalued |
-9.13% |
13.19 |
|
0.34% |
-3.62% |
-20.12% |
15.14% undervalued |
-23.09% |
22.24 |
|
0.05% |
-5.99% |
-17.29% |
15.46% undervalued |
-22.00% |
14.13 |
|
1.63% |
-8.98% |
-27.79% |
16.15% undervalued |
-37.06% |
23.19 |
ValuEngine.com is an independent research provider, producing buy/hold/sell recommendations, target price, and valuations on over 7,000 US and Canadian equities every trading day.
Visit www.ValuEngine.com for more information

|


