December 14, 2015
VALUATION WATCH: Overvalued stocks now make up 38.05% of our stocks assigned a valuation and 12.26% of those equities are calculated to be overvalued by 20% or more. Two sectors are calculated to be overvalued.
UPGRADES
--ValuEngine Top-Five BUY/STRONG BUY Upgrades
ValuEngine tracks more than 7000 US equities, ADRs, and foreign stock which trade on US exchanges as well as @1000 Canadian equities. When EPS estimates are available for a given equity, our model calculates a level of mispricing or valuation percentage for that equity based on earnings estimates and what the stock should be worth if the market were totally rational and efficient--an academic exercise to be sure, but one which allows for useful comparisons between equities, sectors, and industries. Using our Valuation Model, we can currently assign a VE valuation calculation to more than 2800 stocks in our US Universe.
We combine all of the equities with a valuation calculation to track market valuation figures and use them as a metric for making calls about the overall state of the market. Two factors can lower these figures-- a market pullback, or a significant rise in EPS estimates.
We also use trading data to provide forecast estimates for a variety of time horizons for almost ever equity in our database. Our Buy/Sell/Hold recommendations are based upon the 1-year forecast return figure. Using valuation and forecast figures, you can rank and rate our covered stocks against each other, to find out, in an objective and systematic way, the most attractive investment targets based on your own risk/reward parameters. We re-calculate the entire database every trading day, so you are assured that every proprietary valuation and forecast datapoint is as up-to-date as possible.
So, for today's bulletin we used our website's advanced screening functions to search for UPGRADES to BUY or STRONG BUY which included valuation data. They are presented alphabetically. ADT Corp (ADT) is the leader here.
Ticker |
Company Name |
Market Price |
Valuation |
Last 12-M Return |
1-M Forecast Return |
1-Yr Forecast Return |
P/E Ratio |
Sector Name |
ADT |
ADT CORP |
32.96 |
-11.47% |
4.82% |
0.49% |
5.86% |
17.14 |
Business Services |
AMBA |
AMBARELLA INC |
57.63 |
-23.39% |
15.41% |
0.41% |
4.87% |
22.87 |
Computer and Technology |
HOMB |
HOME BANCSHARES |
39.71 |
3.58% |
31.78% |
0.48% |
5.71% |
20.12 |
Finance |
RS |
RELIANCE STEEL |
56.84 |
-2.24% |
-5.15% |
0.48% |
5.76% |
12.71 |
Industrial Products |
VG |
VONAGE HOLDINGS |
5.62 |
57.16% |
82.93% |
0.45% |
5.34% |
19.78 |
Utilities |
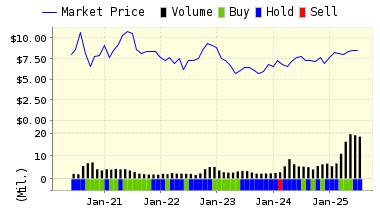
Below is today's data on ADT Corp (ADT):
The ADT Corporation provides electronic security, interactive home and business automation, and related monitoring services primarily in the United States and Canada. Its set of products and services include ADT Pulse, ADT Select, Access Control, Business Intrusion Detection, Business Video Surveillance, Carbon Monoxide Detection, Fire/Smoke Detection, Home Security Systems, Home Video Surveillance, Medical Alert Systems and Monitoring Services. The Company operates through a network of dealers, affinity organizations, and technology providers. The ADT Corporation is based in Boca Raton, Florida.
VALUENGINE RECOMMENDATION: ValuEngine updated its recommendation from HOLD to BUY for ADT CORP on 2015-12-11. Based on the information we have gathered and our resulting research, we feel that ADT CORP has the probability to OUTPERFORM average market performance for the next year. The company exhibits ATTRACTIVE Company Size and Momentum.
You can download a free copy of detailed report on ADT from the link below.
ValuEngine Forecast |
| |
Target
Price* |
Expected
Return |
1-Month |
33.14 |
0.53% |
3-Month |
33.17 |
0.63% |
6-Month |
33.28 |
0.97% |
1-Year |
35.06 |
6.39% |
2-Year |
32.82 |
-0.43% |
3-Year |
30.17 |
-8.45% |
Valuation & Rankings |
Valuation |
13.44% undervalued |
|
 62 62 |
1-M Forecast Return |
0.53% |
1-M Forecast Return Rank |
86 |
12-M Return |
4.80% |
|
73 |
Sharpe Ratio |
-0.19 |
|
40 |
5-Y Avg Annual Return |
-5.10% |
5-Y Avg Annual Rtn Rank |
43 |
Volatility |
26.69% |
|
62 |
Expected EPS Growth |
8.87% |
|
40 |
Market Cap (billions) |
5.64 |
Size Rank |
86 |
Trailing P/E Ratio |
16.87 |
|
65 |
Forward P/E Ratio |
15.50 |
Forward P/E Ratio Rank |
46 |
PEG Ratio |
1.90 |
PEG Ratio Rank |
24 |
Price/Sales |
1.58 |
|
50 |
Market/Book |
1.93 |
|
49 |
Beta |
1.33 |
Beta Rank |
26 |
Alpha |
0.01 |
Alpha Rank |
65 |

DOWNLOAD A FREE SAMPLE OF OUR ADT CORP (ADT) REPORT BY CLICKING HERE
(LINK FIXED)
ValuEngine Market Overview
Summary of VE Stock Universe |
Stocks Undervalued |
61.95% |
Stocks Overvalued |
38.05% |
Stocks Undervalued by 20% |
29.6% |
Stocks Overvalued by 20% |
12.26% |
ValuEngine Sector Overview
|
|
|
|
|
|
|
|
-1.41% |
-2.71% |
2.83% |
3.29% overvalued |
-1.26% |
23.06 |
|
-2.28% |
-4.33% |
-3.91% |
0.11% overvalued |
-5.61% |
24.31 |
|
-2.30% |
-5.47% |
-14.08% |
0.08% undervalued |
-12.39% |
16.64 |
|
-1.84% |
-4.27% |
-0.57% |
0.64% undervalued |
-2.55% |
27.75 |
|
-1.62% |
-4.50% |
1.10% |
2.16% undervalued |
-1.96% |
27.84 |
|
-1.62% |
-4.14% |
-0.62% |
2.54% undervalued |
-5.06% |
22.14 |
|
-1.80% |
-4.55% |
-1.37% |
3.37% undervalued |
-4.74% |
15.74 |
|
-1.60% |
-5.58% |
-2.15% |
4.85% undervalued |
-5.84% |
19.98 |
|
-1.55% |
-3.67% |
-2.15% |
6.20% undervalued |
-4.33% |
24.68 |
|
-2.04% |
-5.74% |
-10.91% |
6.83% undervalued |
-11.81% |
21.15 |
|
-1.86% |
-5.46% |
-10.32% |
7.45% undervalued |
-11.66% |
17.99 |
|
-1.60% |
-3.22% |
-9.36% |
8.90% undervalued |
-7.59% |
23.09 |
|
-2.36% |
-6.56% |
-9.91% |
14.08% undervalued |
-9.84% |
12.93 |
|
-1.64% |
-4.58% |
-20.82% |
16.52% undervalued |
-21.63% |
22.19 |
|
-2.62% |
-8.00% |
-18.98% |
18.17% undervalued |
-23.73% |
14.72 |
|
-3.93% |
-12.33% |
-30.31% |
19.50% undervalued |
-36.06% |
23.58 |
ValuEngine.com is an independent research provider, producing buy/hold/sell recommendations, target price, and valuations on over 7,000 US and Canadian equities every trading day.
Visit www.ValuEngine.com for more information

|


