December 17, 2015
VALUATION WATCH: Overvalued stocks now make up 44.79% of our stocks assigned a valuation and 15.69% of those equities are calculated to be overvalued by 20% or more. Six sectors are calculated to be overvalued.
Editor's Note: Due to the US Winter Holiday Season, our free newsletters will be on a reduced publication schedule from December 22nd until January 4th. Readers should expect limited Daily and Weekly newsletters during this timeframe due to holiday vacations and market closures. We wish all readers a Merry Christmas and a Happy New Year.
Indexing
--ValuEngine Rates and Ranks the S&P500
ValuEngine tracks more than 7000 US equities, ADRs, and foreign stock which trade on US exchanges as well as @1000 Canadian equities. When EPS estimates are available for a given equity, our model calculates a level of mispricing or valuation percentage for that equity based on earnings estimates and what the stock should be worth if the market were totally rational and efficient--an academic exercise to be sure, but one which allows for useful comparisons between equities, sectors, and industries. Using our Valuation Model, we can currently assign a VE valuation calculation to more than 2800 stocks in our US Universe.
We also use trading data to provide forecast estimates for a variety of time horizons for almost ever equity in our database. Our Buy/Sell/Hold recommendations are based upon the 1-year forecast return figure. Using valuation and forecast figures, you can rank and rate our covered stocks against each other, to find out, in an objective and systematic way, the most attractive investment targets based on your own risk/reward parameters. We re-calculate the entire database every trading day, so you are assured that every proprietary valuation and forecast datapoint is as up-to-date as possible.
We can use our data to track individual stocks, industries, sectors, and indices. For today's bulletin, we present key metrics for the top picks in the S&P 500. The companies listed below represent the top-ten STRONG BUY stocks within the index. They are presented below according to their one-month forecast target prices.
The components of this list are little changed since the last time we presented the top S&P picks a month ago. PSX and GILD are newcomers--they replaced AAL and UAL. Tesoro Corp remains the overall leader.
Ticker |
Company Name |
Market Price |
Valuation |
Last 12-M Retrn |
1-M Forecast Retn |
1-Yr Forecast Retn |
P/E Ratio |
Sector Name |
Last Month Top Ten |
TSO |
TESORO CORP |
104.79 |
-3.84% |
41.21% |
1.60% |
19.40% |
7.50 |
Oils-Energy |
TSO |
LYB |
LYONDELLBASEL-A |
88.93 |
-17.91% |
24.29% |
1.52% |
18.40% |
8.58 |
Basic Materials |
VLO |
VLO |
VALERO ENERGY |
70.2 |
9.93% |
49.27% |
1.46% |
17.63% |
7.93 |
Oils-Energy |
GM |
MPC |
MARATHON PETROL |
49.7 |
-5.46% |
20.92% |
1.41% |
17.04% |
8.49 |
Oils-Energy |
DAL |
GM |
GENERAL MOTORS |
35.14 |
-6.20% |
14.35% |
1.35% |
16.32% |
7.26 |
Auto-Tires-Trucks |
MPC |
PSX |
PHILLIPS 66 |
83.06 |
9.28% |
23.90% |
1.16% |
13.99% |
10.47 |
Oils-Energy |
AAL |
DAL |
DELTA AIR LINES |
52.12 |
-6.27% |
14.85% |
1.10% |
13.26% |
11.55 |
Transportation |
UAL |
GT |
GOODYEAR TIRE |
33.33 |
22.57% |
25.73% |
1.05% |
12.57% |
10.87 |
Auto-Tires-Trucks |
LYB |
GILD |
GILEAD SCIENCES |
103.34 |
-3.30% |
2.87% |
1.01% |
12.10% |
8.69 |
Medical |
LUV |
LUV |
SOUTHWEST AIR |
44.8 |
-9.09% |
13.19% |
0.99% |
11.85% |
13.07 |
Transportation |
GT |
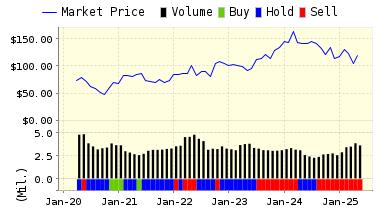
Below is today's data on newcomer PSX:
Phillips 66 is a downstream energy company. It operates in three segments: Refining & Marketing, Midstream and Chemicals. The Refining and Marketing segment purchases, refines, markets and transports crude oil and petroleum products, mainly in the United States, Europe and Asia and also engages in power generation activities, lubricants and other specialty products businesses. The Midstream segment gathers, processes, transports and markets natural gas and fractionates and markets NGL, predominantly in the United States. The Chemicals segment manufactures and markets petrochemicals and plastics. Phillips 66 is headquartered in Houston, Texas.
VALUENGINE RECOMMENDATION: ValuEngine continues its STRONG BUY recommendation on PHILLIPS 66 for 2015-12-16. Based on the information we have gathered and our resulting research, we feel that PHILLIPS 66 has the probability to OUTPERFORM average market performance for the next year. The company exhibits ATTRACTIVE Sharpe Ratio and Company Size.
You can download a free copy of detailed report on PSX from the link below.
ValuEngine Forecast |
| |
Target
Price* |
Expected
Return |
1-Month |
84.03 |
1.16% |
3-Month |
86.17 |
3.74% |
6-Month |
89.01 |
7.16% |
1-Year |
94.68 |
13.99% |
2-Year |
97.85 |
17.81% |
3-Year |
100.53 |
21.04% |
Valuation & Rankings |
Valuation |
9.28% overvalued |
|
 29 29 |
1-M Forecast Return |
1.16% |
1-M Forecast Return Rank |
99 |
12-M Return |
23.90% |
|
85 |
Sharpe Ratio |
1.31 |
|
99 |
5-Y Avg Annual Return |
31.84% |
5-Y Avg Annual Rtn Rank |
97 |
Volatility |
24.38% |
|
66 |
Expected EPS Growth |
-5.04% |
|
19 |
Market Cap (billions) |
45.97 |
Size Rank |
98 |
Trailing P/E Ratio |
10.47 |
|
88 |
Forward P/E Ratio |
11.02 |
Forward P/E Ratio Rank |
74 |
PEG Ratio |
n/a |
PEG Ratio Rank |
n/a |
Price/Sales |
0.41 |
|
84 |
Market/Book |
2.31 |
|
44 |
Beta |
1.39 |
Beta Rank |
24 |
Alpha |
0.22 |
Alpha Rank |
87 |

DOWNLOAD A FREE SAMPLE OF OUR PHILLIPS 66 (PSX) REPORT BY CLICKING HERE
(LINK FIXED)
ValuEngine Market Overview
Summary of VE Stock Universe |
Stocks Undervalued |
55.21% |
Stocks Overvalued |
44.79% |
Stocks Undervalued by 20% |
27.2% |
Stocks Overvalued by 20% |
15.69% |
ValuEngine Sector Overview
|
|
|
|
|
|
|
|
1.48% |
-1.05% |
4.16% |
7.03% overvalued |
2.79% |
23.56 |
|
0.89% |
-2.97% |
0.99% |
2.94% overvalued |
-2.48% |
24.86 |
|
1.17% |
-4.67% |
-13.48% |
2.67% overvalued |
-9.87% |
16.68 |
|
0.80% |
-3.35% |
0.40% |
2.34% overvalued |
0.70% |
28.17 |
|
1.45% |
-2.99% |
2.59% |
2.18% overvalued |
3.07% |
28.76 |
|
1.02% |
-2.85% |
0.28% |
0.53% overvalued |
-1.54% |
16.19 |
|
0.50% |
-4.19% |
-0.53% |
0.05% undervalued |
-0.88% |
22.44 |
|
1.16% |
-5.25% |
-0.90% |
1.99% undervalued |
-2.08% |
20.33 |
|
2.07% |
-3.18% |
-8.82% |
2.10% undervalued |
-6.75% |
21.93 |
|
1.27% |
-2.66% |
-0.91% |
3.22% undervalued |
-1.37% |
24.70 |
|
1.18% |
-5.33% |
-10.16% |
5.91% undervalued |
-8.39% |
17.96 |
|
1.25% |
-1.92% |
-8.54% |
6.45% undervalued |
-4.81% |
23.37 |
|
1.56% |
-4.70% |
-8.07% |
10.98% undervalued |
-9.31% |
13.08 |
|
1.59% |
-6.32% |
-17.49% |
15.58% undervalued |
-21.94% |
13.05 |
|
1.49% |
-4.98% |
-20.98% |
15.59% undervalued |
-18.68% |
22.55 |
|
0.91% |
-11.37% |
-28.64% |
16.78% undervalued |
-34.82% |
23.76 |
ValuEngine.com is an independent research provider, producing buy/hold/sell recommendations, target price, and valuations on over 7,000 US and Canadian equities every trading day.
Visit www.ValuEngine.com for more information

|


