December 31, 2015
VALUATION WATCH: Overvalued stocks now make up 45.48% of our stocks assigned a valuation and 17.07% of those equities are calculated to be overvalued by 20% or more. Eight sectors are calculated to be overvalued.
Editor's Note: Due to the US Winter Holiday Season, our free newsletters will be on a reduced publication schedule from December 22nd until January 4th. Readers should expect limited Daily and Weekly newsletters during this timeframe due to holiday vacations and market closures. We wish all readers a Merry Christmas and a Happy New Year.
Indexing
--ValuEngine Rates and Ranks the NASDAQ
ValuEngine tracks more than 7000 US equities, ADRs, and foreign stock which trade on US exchanges as well as @1000 Canadian equities. When EPS estimates are available for a given equity, our model calculates a level of mispricing or valuation percentage for that equity based on earnings estimates and what the stock should be worth if the market were totally rational and efficient--an academic exercise to be sure, but one which allows for useful comparisons between equities, sectors, and industries. Using our Valuation Model, we can currently assign a VE valuation calculation to more than 2800 stocks in our US Universe.
We also use trading data to provide forecast estimates for a variety of time horizons for almost ever equity in our database. Our Buy/Sell/Hold recommendations are based upon the 1-year forecast return figure. Using valuation and forecast figures, you can rank and rate our covered stocks against each other, to find out, in an objective and systematic way, the most attractive investment targets based on your own risk/reward parameters. We re-calculate the entire database every trading day, so you are assured that every proprietary valuation and forecast datapoint is as up-to-date as possible.
We can use our data to track individual stocks, industries, sectors, and indices. For today's bulletin, we present key metrics for the top picks in the NASDAQ 100. The companies listed below represent the top-ten BUY and STRONG BUY stocks within the index. They are presented below according to their one-month forecast target prices.
Gilead Sciences is the overall leader and is the only STRONG BUY stock in this list. The components are little changed since the last time we presented the top NASDAQ picks at the beginning of December
Ticker |
Company Name |
Market Price |
Valuation |
Last 12-M Retrn |
1-M Forecast Retn |
1-Yr Forecast Retn |
P/E Ratio |
Sector |
12-2-15 Leaders |
GILD |
GILEAD SCIENCES |
102.16 |
-3.98% |
7.23% |
1.19% |
14.38% |
8.58 |
Medical |
GILD |
SWKS |
SKYWORKS SOLUTN |
79.19 |
-19.50% |
8.69% |
0.81% |
9.67% |
15.88 |
Computer and Technology |
AVGO |
AVGO |
AVAGO TECHNOLOG |
147.37 |
6.18% |
46.13% |
0.76% |
9.13% |
17.57 |
Computer and Technology |
SWKS |
AAPL |
APPLE INC |
107.32 |
-12.87% |
-4.62% |
0.74% |
8.80% |
11.50 |
Computer and Technology |
AAL |
LRCX |
LAM RESEARCH |
80.17 |
1.74% |
0.29% |
0.67% |
7.99% |
13.22 |
Computer and Technology |
AAPL |
AAL |
AMER AIRLINES |
42.8 |
-8.13% |
-19.88% |
0.66% |
7.86% |
4.81 |
Transportation |
CSCO |
MYL |
MYLAN NV |
54.62 |
-14.13% |
-4.07% |
0.64% |
7.63% |
12.93 |
Medical |
MYL |
NXPI |
NXP SEMICONDUCT |
85.76 |
2.47% |
13.47% |
0.54% |
6.50% |
17.60 |
Computer and Technology |
LRCX |
CSCO |
CISCO SYSTEMS |
27.53 |
0.96% |
-2.93% |
0.53% |
6.34% |
13.50 |
Computer and Technology |
ESRX |
ESRX |
EXPRESS SCRIPTS |
87.87 |
0.57% |
2.47% |
0.50% |
5.98% |
16.02 |
Medical |
NXPI |
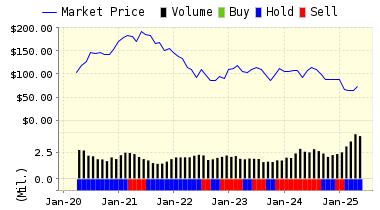
Below is today's data on Skyworks Solutions (SWKS):
Skyworks Solutions, Inc. is the industry's leading wireless semiconductor company focused on radio frequency (RF) and complete semiconductor system solutions for mobile communications applications.
VALUENGINE RECOMMENDATION: ValuEngine continues its BUY recommendation on SKYWORKS SOLUTN for 2015-12-30. Based on the information we have gathered and our resulting research, we feel that SKYWORKS SOLUTN has the probability to OUTPERFORM average market performance for the next year. The company exhibits ATTRACTIVE Company Size and Sharpe Ratio.
You can download a free copy of detailed report on SWKS from the link below.
ValuEngine Forecast |
| |
Target
Price* |
Expected
Return |
1-Month |
79.83 |
0.81% |
3-Month |
79.79 |
0.75% |
6-Month |
79.53 |
0.43% |
1-Year |
86.85 |
9.67% |
2-Year |
73.69 |
-6.94% |
3-Year |
59.91 |
-24.35% |
Valuation & Rankings |
Valuation |
19.50% undervalued |
|
 74 74 |
1-M Forecast Return |
0.81% |
1-M Forecast Return Rank |
95 |
12-M Return |
8.69% |
|
77 |
Sharpe Ratio |
0.63 |
|
87 |
5-Y Avg Annual Return |
23.65% |
5-Y Avg Annual Rtn Rank |
94 |
Volatility |
37.39% |
|
47 |
Expected EPS Growth |
22.59% |
|
62 |
Market Cap (billions) |
15.10 |
Size Rank |
93 |
Trailing P/E Ratio |
15.88 |
|
70 |
Forward P/E Ratio |
12.95 |
Forward P/E Ratio Rank |
64 |
PEG Ratio |
0.70 |
PEG Ratio Rank |
54 |
Price/Sales |
4.63 |
|
19 |
Market/Book |
6.69 |
|
17 |
Beta |
1.23 |
Beta Rank |
31 |
Alpha |
0.20 |
Alpha Rank |
85 |

DOWNLOAD A FREE SAMPLE OF OUR SKYWORKS SOLUTIONS (SWKS) REPORT BY CLICKING HERE
(LINK FIXED)
ValuEngine Market Overview
Summary of VE Stock Universe |
Stocks Undervalued |
54.52% |
Stocks Overvalued |
45.48% |
Stocks Undervalued by 20% |
26.38% |
Stocks Overvalued by 20% |
17.07% |
ValuEngine Sector Overview
|
|
|
|
|
|
|
|
-0.64% |
-0.97% |
4.63% |
7.60% overvalued |
-1.31% |
23.62 |
|
-0.42% |
-3.66% |
-12.66% |
5.29% overvalued |
-11.81% |
16.92 |
|
-0.47% |
-1.13% |
3.58% |
3.76% overvalued |
-0.15% |
28.88 |
|
-0.68% |
-2.60% |
1.35% |
3.63% overvalued |
-1.60% |
28.55 |
|
-0.54% |
-2.92% |
1.14% |
2.91% overvalued |
-7.18% |
24.17 |
|
0.19% |
-2.30% |
1.14% |
2.30% overvalued |
-2.59% |
20.38 |
|
-0.62% |
-2.58% |
0.48% |
1.09% overvalued |
-4.09% |
15.98 |
|
-1.28% |
-1.23% |
-8.32% |
0.34% overvalued |
-8.69% |
21.57 |
|
-0.09% |
-4.47% |
-0.23% |
0.28% undervalued |
-5.97% |
20.22 |
|
-0.49% |
-2.83% |
-1.16% |
3.79% undervalued |
-6.46% |
24.66 |
|
-0.58% |
-5.23% |
-10.22% |
4.51% undervalued |
-11.21% |
18.17 |
|
-0.45% |
-1.83% |
-8.37% |
6.00% undervalued |
-8.33% |
23.38 |
|
-0.96% |
-4.93% |
-8.37% |
10.65% undervalued |
-13.21% |
12.90 |
|
-0.94% |
-3.79% |
-20.12% |
12.85% undervalued |
-22.42% |
23.56 |
|
-2.08% |
-10.96% |
-28.08% |
15.20% undervalued |
-37.32% |
23.56 |
|
-0.52% |
-6.20% |
-17.29% |
15.94% undervalued |
-26.33% |
12.92 |
ValuEngine.com is an independent research provider, producing buy/hold/sell recommendations, target price, and valuations on over 7,000 US and Canadian equities every trading day.
Visit www.ValuEngine.com for more information

|


