January 4, 2016
VALUATION WATCH: Overvalued stocks now make up 43.21% of our stocks assigned a valuation and 15.75% of those equities are calculated to be overvalued by 20% or more. Six sectors are calculated to be overvalued.
UPGRADES
--ValuEngine Top-Five BUY/STRONG BUY Upgrades
ValuEngine tracks more than 7000 US equities, ADRs, and foreign stock which trade on US exchanges as well as @1000 Canadian equities. When EPS estimates are available for a given equity, our model calculates a level of mispricing or valuation percentage for that equity based on earnings estimates and what the stock should be worth if the market were totally rational and efficient--an academic exercise to be sure, but one which allows for useful comparisons between equities, sectors, and industries. Using our Valuation Model, we can currently assign a VE valuation calculation to more than 2800 stocks in our US Universe.
We combine all of the equities with a valuation calculation to track market valuation figures and use them as a metric for making calls about the overall state of the market. Two factors can lower these figures-- a market pullback, or a significant rise in EPS estimates.
We also use trading data to provide forecast estimates for a variety of time horizons for almost ever equity in our database. Our Buy/Sell/Hold recommendations are based upon the 1-year forecast return figure. Using valuation and forecast figures, you can rank and rate our covered stocks against each other, to find out, in an objective and systematic way, the most attractive investment targets based on your own risk/reward parameters. We re-calculate the entire database every trading day, so you are assured that every proprietary valuation and forecast datapoint is as up-to-date as possible.
So, for today's bulletin we used our website's advanced screening functions to search for UPGRADES to BUY or STRONG BUY. They are presented alphabetically. Chiba Bank LTD (CHBAY) is the leader here.
Ticker |
Company Name |
Market Price |
Valuation |
Last 12-M Return |
1-M Forecast Return |
1-Yr Forecast Return |
P/E Ratio |
Sector Name |
CHBAY |
CHIBA BANK LTD |
35.9 |
N/A |
8.30% |
1.10% |
13.25% |
N/A |
Finance |
GWGH |
GWG HOLDINGS |
6.44 |
N/A |
-4.73% |
0.54% |
6.48% |
12.46 |
Finance |
JBAXY |
JULIUS BAER GRP |
9.7 |
N/A |
7.06% |
1.08% |
13.02% |
N/A |
Finance |
OVLY |
OAK VALLEY BNCP |
10.4 |
N/A |
2.36% |
0.52% |
6.22% |
15.12 |
Finance |
WAVX |
WAVE SYSTEMS -A |
1.39 |
N/A |
73.75% |
0.79% |
9.50% |
N/A |
Computer and Technology |
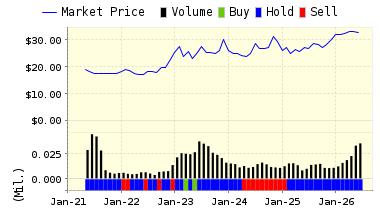
Below is today's data on Oak Valley Bancorp (OVLY):
Oak Valley Bancorp operates as the holding company for Oak Valley Community Bank, which provides various banking products and services in California. The companys deposit products include demand, negotiable order of withdrawal, money market, savings, and time deposits, as well as certificates of deposit and individual retirement accounts. It also offers a portfolio of loans comprising commercial real estate loans, commercial loans, real estate construction loans, agriculture, and residential real estate and consumer loans. The company is based in Oakdale, California.
VALUENGINE RECOMMENDATION: ValuEngine updated its recommendation from HOLD to BUY for OAK VALLEY BNCP on 2015-12-31. Based on the information we have gathered and our resulting research, we feel that OAK VALLEY BNCP has the probability to OUTPERFORM average market performance for the next year. The company exhibits ATTRACTIVE Sharpe Ratio and P/E Ratio.
You can download a free copy of detailed report on OVLY from the link below.
ValuEngine Forecast |
| |
Target
Price* |
Expected
Return |
1-Month |
10.45 |
0.52% |
3-Month |
10.61 |
2.02% |
6-Month |
10.85 |
4.32% |
1-Year |
11.05 |
6.22% |
2-Year |
11.69 |
12.43% |
3-Year |
12.10 |
16.36% |
Valuation & Rankings |
Valuation |
n/a |
|
 n/a n/a |
1-M Forecast Return |
0.52% |
1-M Forecast Return Rank |
85 |
12-M Return |
2.36% |
|
70 |
Sharpe Ratio |
0.39 |
|
77 |
5-Y Avg Annual Return |
11.94% |
5-Y Avg Annual Rtn Rank |
81 |
Volatility |
30.49% |
|
56 |
Expected EPS Growth |
n/a |
|
n/a |
Market Cap (billions) |
0.08 |
Size Rank |
34 |
Trailing P/E Ratio |
15.12 |
|
73 |
Forward P/E Ratio |
n/a |
Forward P/E Ratio Rank |
n/a |
PEG Ratio |
n/a |
PEG Ratio Rank |
n/a |
Price/Sales |
2.78 |
|
32 |
Market/Book |
1.09 |
|
71 |
Beta |
1.01 |
Beta Rank |
43 |
Alpha |
-0.02 |
Alpha Rank |
52 |

DOWNLOAD A FREE SAMPLE OF OUR OAK VALLEY BANCORP SUMMARY REPORT BY CLICKING HERE
(LINK FIXED)
ValuEngine Market Overview
Summary of VE Stock Universe |
Stocks Undervalued |
56.79% |
Stocks Overvalued |
43.21% |
Stocks Undervalued by 20% |
26.99% |
Stocks Overvalued by 20% |
15.75% |
ValuEngine Sector Overview
|
|
|
|
|
|
|
|
-0.64% |
-0.97% |
4.63% |
6.15% overvalued |
-1.90% |
23.45 |
|
-0.42% |
-3.66% |
-12.66% |
4.97% overvalued |
-11.18% |
16.87 |
|
-0.47% |
-1.13% |
3.58% |
2.54% overvalued |
-0.82% |
28.55 |
|
-0.68% |
-2.60% |
1.35% |
2.18% overvalued |
-2.65% |
27.98 |
|
-0.54% |
-2.92% |
1.14% |
1.81% overvalued |
-6.52% |
24.08 |
|
0.19% |
-2.30% |
1.14% |
1.36% overvalued |
0.49% |
20.26 |
|
-0.62% |
-2.58% |
0.48% |
0.19% undervalued |
-4.31% |
16.01 |
|
-1.28% |
-1.23% |
-8.32% |
1.12% undervalued |
-8.74% |
21.38 |
|
-0.09% |
-4.47% |
-0.23% |
1.29% undervalued |
-6.10% |
20.08 |
|
-0.48% |
-3.00% |
0.95% |
4.81% undervalued |
-6.78% |
24.58 |
|
-0.58% |
-5.23% |
-10.22% |
5.68% undervalued |
-10.42% |
17.98 |
|
-0.45% |
-1.83% |
-8.37% |
7.03% undervalued |
-8.75% |
23.24 |
|
-0.96% |
-4.93% |
-8.37% |
11.87% undervalued |
-14.16% |
12.77 |
|
-0.94% |
-3.79% |
-20.12% |
13.43% undervalued |
-22.86% |
23.48 |
|
-2.08% |
-10.96% |
-28.08% |
14.33% undervalued |
-35.71% |
24.00 |
|
-0.52% |
-6.20% |
-17.29% |
16.11% undervalued |
-23.50% |
12.98 |
ValuEngine.com is an independent research provider, producing buy/hold/sell recommendations, target price, and valuations on over 7,000 US and Canadian equities every trading day.
Visit www.ValuEngine.com for more information

|


