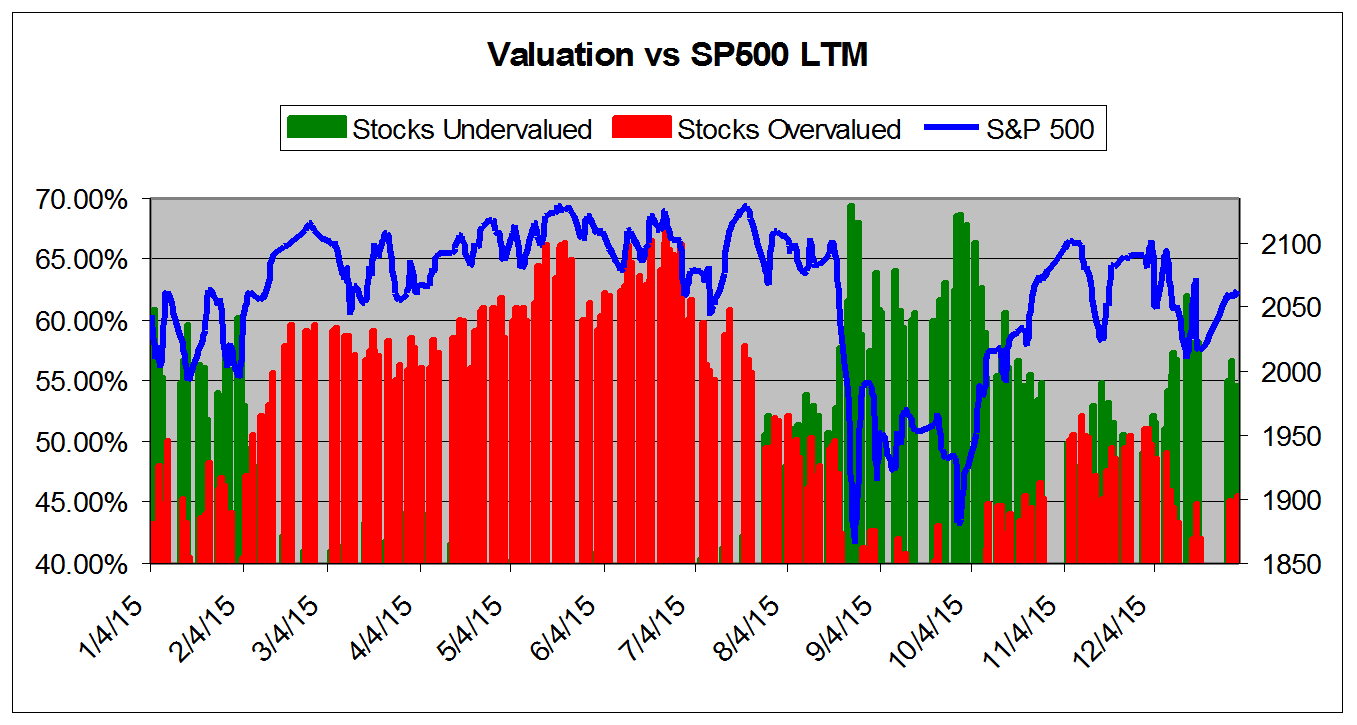
January 5, 2016VALUATION WATCH: Overvalued stocks now make up 39.19% of our stocks assigned a valuation and 13.08% of those equities are calculated to be overvalued by 20% or more. Three sectors are calculated to be overvalued--with one in the double digits. Happy New YearValuations On The Cheap Side As 2016 BeginsValuEngine tracks more than 7000 US equities, ADRs, and foreign stock which trade on US exchanges as well as @1000 Canadian equities. When EPS estimates are available for a given equity, our model calculates a level of mispricing or valuation percentage for that equity based on earnings estimates and what the stock should be worth if the market were totally rational and efficient--an academic exercise to be sure, but one which allows for useful comparisons between equities, sectors, and industries. Using our Valuation Model, we can currently assign a VE valuation calculation to more than 2800 stocks in our US Universe. We combine all of the equities with a valuation calculation to track market valuation figures and use them as a metric for making calls about the overall state of the market. Two factors can lower these figures-- a market pullback, or a significant rise in EPS estimates. Vice-versa, a significant rally or reduction in EPS can raise the figure. Whenever we see overvaluation levels in excess of @ 65% for the overall universe and/or 27% for the overvalued by 20% or more categories, we issue a valuation warning. We now calculate that 39% of the stocks we can assign a valuation are overvalued and 13% of those stocks are overvalued by 20% or more. These numbers have decreased significantly since the last time we published our monthly valuation study. We are now showing stocks that are cheaper from our Valuation Model's perspective. Certainly not as cheap as we have seen, but more of a bargain than we saw back in November. Those factors may have a contagion effect for the US markets, even as the US remains the economy of last resort and the US dollar remains a safe haven. You can see their effects on the market so far this year, as 2016 is proving to be a bit of a downer so far with investors selling off positions due to short-term fears over China and share-price declines in their markets. The chart below tracks the valuation metrics from January 2015. It shows levels in excess of 40%.
This chart shows overall universe over valuation in excess of 40% vs the S&P 500 from January 2013
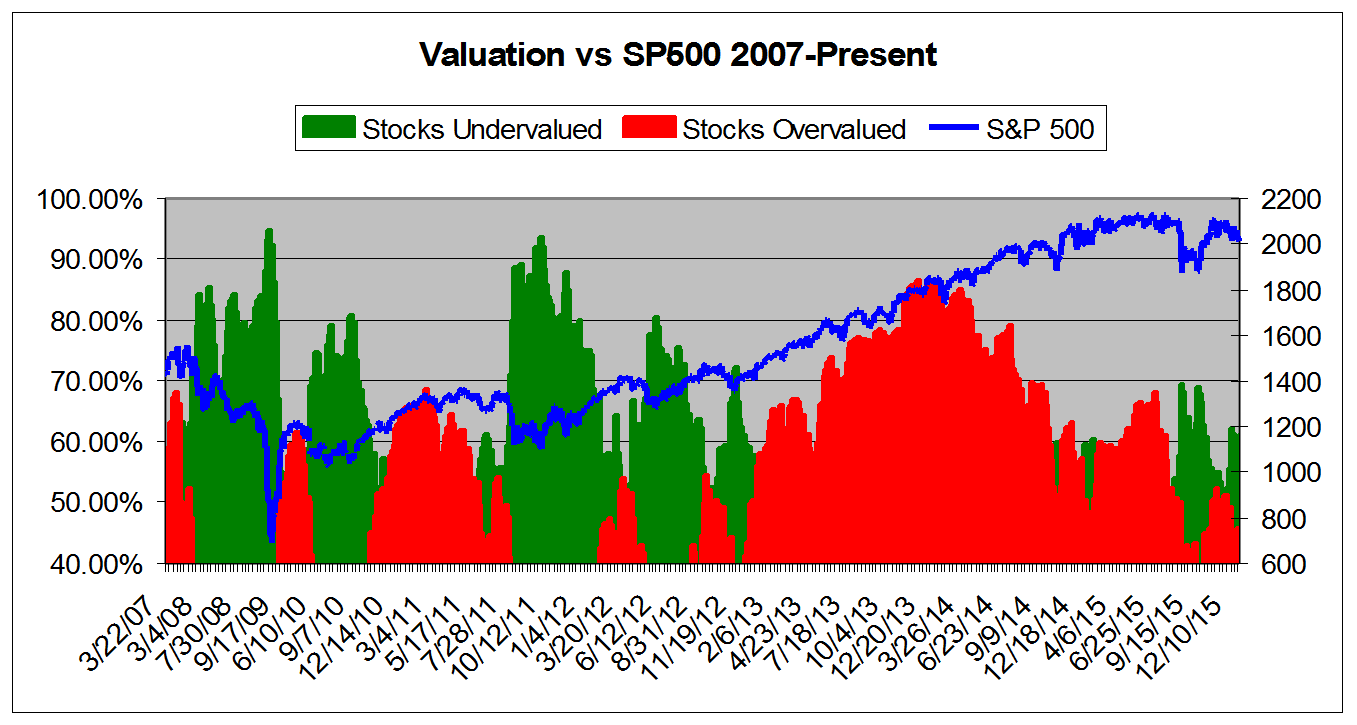
This chart shows overall universe under and over valuation in excess of 40% vs the S&P 500 from March 2007*
ValuEngine Market Overview
ValuEngine Sector Overview
ValuEngine.com is an independent research provider, producing buy/hold/sell recommendations, target price, and valuations on over 7,000 US and Canadian equities every trading day.
Visit www.ValuEngine.com for more information
|
|||||||||||||||||||||||||||||||||||||||||||||||||||||||||||||||||||||||||||||||||||||||||||||||||||||||||||||||||||||||||||||||||||