February 18, 2016
VALUATION WATCH: Overvalued stocks now make up 27.29% of our stocks assigned a valuation and 8.17% of those equities are calculated to be overvalued by 20% or more. One sector is calculated to be overvalued.
Indexing
--ValuEngine Rates and Ranks the DOW
ValuEngine tracks more than 7000 US equities, ADRs, and foreign stock which trade on US exchanges as well as @1000 Canadian equities. When EPS estimates are available for a given equity, our model calculates a level of mispricing or valuation percentage for that equity based on earnings estimates and what the stock should be worth if the market were totally rational and efficient--an academic exercise to be sure, but one which allows for useful comparisons between equities, sectors, and industries. Using our Valuation Model, we can currently assign a VE valuation calculation to more than 2800 stocks in our US Universe.
We also use trading data to provide forecast estimates for a variety of time horizons for almost ever equity in our database. Our Buy/Sell/Hold recommendations are based upon the 1-year forecast return figure. Using valuation and forecast figures, you can rank and rate our covered stocks against each other, to find out, in an objective and systematic way, the most attractive investment targets based on your own risk/reward parameters. We re-calculate the entire database every trading day, so you are assured that every proprietary valuation and forecast datapoint is as up-to-date as possible.
We can use our data to track individual stocks, industries, sectors, and indices. For today's bulletin, we present key metrics for the top picks in the Dow Jones Industrials. The companies listed below represent the top buy-rated stocks within the index. They are presented below according to their one-month forecast gain.
Traveler's Insurance remains the overall leader. While the top-five picks have not changed, we see three new selections joining a declining Apple and a rising Cisco at the bottom of the list. United Health Care, Nike, and Boeing have dropped out of our top-ten list since the last time we presented the top Dow picks a month ago.
Ticker |
Company Name |
Market Price |
Valuation |
Last 12-M Retrn |
1-M Forecast Retn |
1-Yr Forecast Retn |
P/E Ratio |
Sector Name |
January 14, 2016 |
TRV |
TRAVELERS COS |
109.18 |
-2.04 |
1.14 |
13.74 |
1.09 |
10.03 |
Finance |
TRV |
JPM |
JPMORGAN CHASE |
58.77 |
-4.01 |
1.01 |
12.13 |
-2.21 |
10.35 |
Finance |
JPM |
VZ |
VERIZON COMM |
50.32 |
2.03 |
0.94 |
11.28 |
2.32 |
12.58 |
Utilities |
VZ |
GS |
GOLDMAN SACHS |
150.94 |
-22.02 |
0.66 |
7.93 |
-20.57 |
8.48 |
Finance |
GS |
IBM |
INTL BUS MACH |
126.1 |
-14.16 |
0.62 |
7.39 |
-21.66 |
8.59 |
Computer and Technology |
IBM |
CSCO |
CISCO SYSTEMS |
26.46 |
-5.48 |
0.58 |
6.96 |
-9.72 |
12.78 |
Computer and Technology |
AAPL |
JNJ |
JOHNSON & JOHNS |
102.5 |
-5.88 |
0.53 |
6.41 |
2.05 |
16.46 |
Medical |
UNH |
MSFT |
MICROSOFT CORP |
52.42 |
35.74 |
0.49 |
5.89 |
20.28 |
19.44 |
Computer and Technology |
NKE |
AAPL |
APPLE INC |
98.12 |
-17.15 |
0.44 |
5.24 |
-23.24 |
10.54 |
Computer and Technology |
BA |
INTC |
INTEL CORP |
29.47 |
1.39 |
0.43 |
5.17 |
-15.16 |
12.58 |
Computer and Technology |
CSCO |
NOTE: New stocks are in BOLD, old stocks that have moved up the list are in GREEN, old stocks that have declined in position are in RED, and stocks which have retained their position are in CAPS.
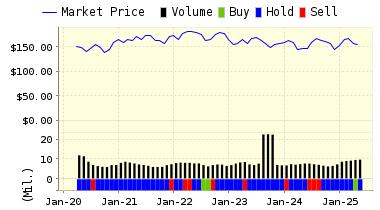
Below is today's data on Johnson & Johnson. (JNJ):
Johnson & Johnson is engaged in the research and development, manufacture and sale of a range of products in the healthcare field. The Company operates in three segments: Consumer, Pharmaceutical, and Medical Devices and Diagnostics. Its Consumer segment offers products for use in the baby care, skin care, oral care, wound care, and women's health fields, nutritional and over-the-counter pharmaceutical products. The company's Pharmaceutical segment provides various products in the areas of anti-infective, antipsychotic, contraceptive, dermatology, gastrointestinal, hematology, immunology, neurology, oncology, pain management, thrombosis, vaccines, and infectious diseases. Its Medical Devices and Diagnostics segment offers electrophysiology and circulatory disease management products; orthopaedic joint reconstruction, spinal care, neurological, and sports medicine products; surgical care, aesthetics, and women's health products. Johnson & Johnson is based in New Brunswick, New Jersey.
VALUENGINE RECOMMENDATION: ValuEngine continues its BUY recommendation on JOHNSON & JOHNS for 2016-02-17. Based on the information we have gathered and our resulting research, we feel that JOHNSON & JOHNS has the probability to OUTPERFORM average market performance for the next year. The company exhibits ATTRACTIVE Company Size and Sharpe Ratio.
You can download a free copy of detailed report on JNJ from the link below.
ValuEngine Forecast |
| |
Target
Price* |
Expected
Return |
1-Month |
103.05 |
0.53% |
3-Month |
103.97 |
1.43% |
6-Month |
106.06 |
3.47% |
1-Year |
109.07 |
6.41% |
2-Year |
113.19 |
10.43% |
3-Year |
115.29 |
12.48% |
Valuation & Rankings |
Valuation |
5.88% undervalued |
|
 38 38 |
1-M Forecast Return |
0.53% |
1-M Forecast Return Rank |
86 |
12-M Return |
2.05% |
|
79 |
Sharpe Ratio |
0.86 |
|
97 |
5-Y Avg Annual Return |
11.16% |
5-Y Avg Annual Rtn Rank |
86 |
Volatility |
12.91% |
|
87 |
Expected EPS Growth |
4.28% |
|
32 |
Market Cap (billions) |
286.91 |
Size Rank |
100 |
Trailing P/E Ratio |
16.46 |
|
64 |
Forward P/E Ratio |
15.79 |
Forward P/E Ratio Rank |
41 |
PEG Ratio |
3.84 |
PEG Ratio Rank |
9 |
Price/Sales |
4.09 |
|
20 |
Market/Book |
11.81 |
|
9 |
Beta |
0.63 |
Beta Rank |
62 |
Alpha |
0.06 |
Alpha Rank |
77 |

DOWNLOAD A FREE SAMPLE OF OUR JOHNSON & JOHNSON (JNJ) REPORT BY CLICKING HERE
(LINK FIXED)
ValuEngine Market Overview
Summary of VE Stock Universe |
Stocks Undervalued |
72.71% |
Stocks Overvalued |
27.29% |
Stocks Undervalued by 20% |
38.82% |
Stocks Overvalued by 20% |
8.17% |
ValuEngine Sector Overview
|
|
|
|
|
|
|
|
2.69% |
-0.36% |
-2.90% |
2.20% overvalued |
-4.69% |
23.82 |
|
2.42% |
-0.89% |
-2.91% |
0.20% undervalued |
-7.57% |
21.25 |
|
4.38% |
1.08% |
-6.56% |
4.92% undervalued |
-16.65% |
15.45 |
|
3.14% |
-2.78% |
-7.83% |
8.15% undervalued |
-15.75% |
20.87 |
|
3.15% |
0.17% |
-6.69% |
8.45% undervalued |
-18.84% |
16.64 |
|
1.89% |
-3.47% |
-11.42% |
9.43% undervalued |
-18.11% |
19.35 |
|
3.22% |
6.68% |
-1.82% |
9.54% undervalued |
-20.83% |
23.90 |
|
3.99% |
-1.37% |
-5.66% |
10.20% undervalued |
-14.19% |
25.46 |
|
2.66% |
-1.47% |
-7.98% |
11.58% undervalued |
-11.03% |
14.99 |
|
3.51% |
-0.63% |
-6.64% |
14.08% undervalued |
-14.57% |
23.16 |
|
4.28% |
0.75% |
-6.02% |
16.18% undervalued |
-18.00% |
22.77 |
|
3.53% |
-1.29% |
-8.91% |
16.59% undervalued |
-16.76% |
17.38 |
|
3.91% |
0.95% |
-7.56% |
17.38% undervalued |
-30.94% |
12.08 |
|
3.64% |
-3.00% |
-14.62% |
18.48% undervalued |
-21.80% |
27.01 |
|
5.69% |
-5.44% |
-12.86% |
19.75% undervalued |
-45.46% |
19.29 |
|
4.39% |
-0.44% |
-8.98% |
20.86% undervalued |
-23.41% |
11.09 |
ValuEngine.com is an independent research provider, producing buy/hold/sell recommendations, target price, and valuations on over 7,000 US and Canadian equities every trading day.
Visit www.ValuEngine.com for more information

|


