February 25, 2016
VALUATION WATCH: Overvalued stocks now make up 28.3% of our stocks assigned a valuation and 8.84% of those equities are calculated to be overvalued by 20% or more. Two sectors are calculated to be overvalued.
Indexing
--ValuEngine Rates and Ranks the S&P500
ValuEngine tracks more than 7000 US equities, ADRs, and foreign stock which trade on US exchanges as well as @1000 Canadian equities. When EPS estimates are available for a given equity, our model calculates a level of mispricing or valuation percentage for that equity based on earnings estimates and what the stock should be worth if the market were totally rational and efficient--an academic exercise to be sure, but one which allows for useful comparisons between equities, sectors, and industries. Using our Valuation Model, we can currently assign a VE valuation calculation to more than 2800 stocks in our US Universe.
We also use trading data to provide forecast estimates for a variety of time horizons for almost ever equity in our database. Our Buy/Sell/Hold recommendations are based upon the 1-year forecast return figure. Using valuation and forecast figures, you can rank and rate our covered stocks against each other, to find out, in an objective and systematic way, the most attractive investment targets based on your own risk/reward parameters. We re-calculate the entire database every trading day, so you are assured that every proprietary valuation and forecast datapoint is as up-to-date as possible.
We can use our data to track individual stocks, industries, sectors, and indices. For today's bulletin, we present key metrics for the top picks in the S&P 500. The companies listed below represent the top-ten BUY/STRONG BUY stocks within the index. They are presented below according to their one-month forecast target prices.
The components of this list have shifted pretty radically since the last time we presented the top S&P picks in January. Delta Airlines, FIrstSolar, Travelers Insurance, Assurant, Hartford Financial, and AFLAC are newcomers--they replaced MPC, LYB, DHI, GM, CB, and JPM. Our new leader is Akron's Finest., Goodyear Tire.

Goodyear Blimp High Over Akron, Ohio
Our list is dominated by Finance and Oil/Energy firms. However, Tesoro has been in trouble lately, Philips 66 is headed down, and only FIrst Solar--a "green" energy firm, shows momentum over the past year.
Ticker |
Company Name |
Market Price |
Valuation |
Last 12-M Retrn |
1-M Forecast Retn |
1-Yr Forecast Retn |
P/E Ratio |
Sector Name |
Last Month Top Ten |
GT |
GOODYEAR TIRE |
29.42 |
-6.81% |
8.44% |
1.35% |
16.30% |
8.78 |
Auto-Tires-Trucks |
TSO |
VLO |
VALERO ENERGY |
60.61 |
-11.53% |
-1.61% |
1.27% |
15.26% |
6.81 |
Oils-Energy |
VLO |
DAL |
DELTA AIR LINES |
48.94 |
-20.02% |
1.89% |
1.20% |
14.39% |
9.94 |
Transportation |
MPC |
FSLR |
FIRST SOLAR INC |
69.45 |
35.38% |
26.97% |
1.15% |
13.87% |
13.06 |
Oils-Energy |
GT |
TRV |
TRAVELERS COS |
108.48 |
-3.44% |
0.86% |
1.15% |
13.80% |
9.96 |
Finance |
PSX |
AIZ |
ASSURANT INC |
70.61 |
12.76% |
16.23% |
1.14% |
13.69% |
12.53 |
Finance |
LYB |
TSO |
TESORO CORP |
78.95 |
-27.02% |
-12.48% |
1.09% |
13.14% |
5.55 |
Oils-Energy |
DHI |
HIG |
HARTFORD FIN SV |
41.9 |
2.01% |
1.40% |
1.08% |
13.01% |
10.79 |
Finance |
GM |
AFL |
AFLAC INC |
59.63 |
2.78% |
-3.92% |
1.02% |
12.25% |
9.65 |
Finance |
CB |
PSX |
PHILLIPS 66 |
79.09 |
4.58% |
-1.14% |
1.02% |
12.24% |
10.38 |
Oils-Energy |
JPM |
NOTE: New stocks are in BOLD, old stocks that have moved up the list are in GREEN, old stocks that have declined in position are in RED, and stocks which have retained their position are in CAPS.
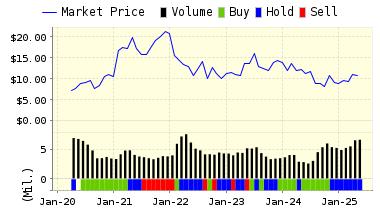
Below is today's data on our SP500 leader,Goodyear Tire (GT):
Goodyear is one of the world's largest tire companies. The company manufactures tires, engineered rubber products and chemicals in facilities in numerous countries. The Company operates in four segments: North America; Europe, Middle East and Africa (EMEA); Latin America, and Asia Pacific. The North America segment is a supplier of tires to manufacturers of automobiles, motorcycles, trucks and aircraft. The EMEA segment is a supplier of tires to vehicle manufacturers across the region. The Latin America segment manufactures and sells automobile and truck tires. The Asia Pacific segment sells primarily Goodyear brand tires throughout the region and also sells the Dunlop brand in Australia and New Zealand. The Company manufactures and sells tires under the Goodyear, Dunlop, Kelly, Debica, Sava and Fulda brands and various other Goodyear owned-house brands, and the private-label brands of certain customers. It has marketing operations in almost every country around the world.
VALUENGINE RECOMMENDATION: ValuEngine continues its STRONG BUY recommendation on GOODYEAR TIRE for 2016-02-24. Based on the information we have gathered and our resulting research, we feel that GOODYEAR TIRE has the probability to OUTPERFORM average market performance for the next year. The company exhibits ATTRACTIVE P/E Ratio and Company Size.
You can download a free copy of detailed report on GT from the link below.
ValuEngine Forecast |
| |
Target
Price* |
Expected
Return |
1-Month |
29.82 |
1.35% |
3-Month |
30.46 |
3.54% |
6-Month |
31.36 |
6.60% |
1-Year |
34.21 |
16.30% |
2-Year |
33.48 |
13.80% |
3-Year |
33.75 |
14.72% |
Valuation & Rankings |
Valuation |
6.81% undervalued |
|
 40 40 |
1-M Forecast Return |
1.35% |
1-M Forecast Return Rank |
100 |
12-M Return |
8.44% |
|
84 |
Sharpe Ratio |
0.48 |
|
87 |
5-Y Avg Annual Return |
17.44% |
5-Y Avg Annual Rtn Rank |
93 |
Volatility |
36.45% |
|
48 |
Expected EPS Growth |
17.91% |
|
58 |
Market Cap (billions) |
8.08 |
Size Rank |
90 |
Trailing P/E Ratio |
8.78 |
|
90 |
Forward P/E Ratio |
7.45 |
Forward P/E Ratio Rank |
87 |
PEG Ratio |
0.49 |
PEG Ratio Rank |
59 |
Price/Sales |
0.49 |
|
78 |
Market/Book |
2.34 |
|
40 |
Beta |
1.96 |
Beta Rank |
11 |
Alpha |
0.21 |
Alpha Rank |
89 |

DOWNLOAD A FREE SAMPLE OF OUR GOODYEAR (GT) REPORT BY CLICKING HERE
ValuEngine Market Overview
Summary of VE Stock Universe |
Stocks Undervalued |
71.7% |
Stocks Overvalued |
28.3% |
Stocks Undervalued by 20% |
37.57% |
Stocks Overvalued by 20% |
8.84% |
ValuEngine Sector Overview
|
|
|
|
|
|
|
|
0.23% |
0.42% |
-1.99% |
2.42% overvalued |
-4.41% |
24.30 |
|
1.01% |
1.48% |
-0.64% |
1.72% overvalued |
-7.96% |
21.81 |
|
1.04% |
1.11% |
-5.89% |
6.78% undervalued |
-17.98% |
16.70 |
|
0.84% |
8.57% |
-0.10% |
6.81% undervalued |
-17.86% |
23.98 |
|
-0.09% |
2.33% |
-5.48% |
7.14% undervalued |
-14.02% |
15.46 |
|
0.79% |
0.78% |
-3.63% |
8.43% undervalued |
-13.11% |
25.54 |
|
0.41% |
-1.56% |
-6.64% |
8.66% undervalued |
-14.81% |
20.74 |
|
-0.05% |
-1.76% |
-9.88% |
8.76% undervalued |
-19.47% |
19.81 |
|
0.05% |
-1.42% |
-7.88% |
11.41% undervalued |
-11.07% |
14.85 |
|
0.29% |
1.06% |
-5.26% |
12.33% undervalued |
-12.69% |
23.68 |
|
0.65% |
0.17% |
-7.69% |
13.31% undervalued |
-15.30% |
17.61 |
|
0.52% |
2.29% |
-4.50% |
15.38% undervalued |
-17.00% |
23.01 |
|
0.13% |
1.80% |
-6.73% |
17.71% undervalued |
-30.15% |
12.09 |
|
0.13% |
-2.28% |
-13.92% |
19.00% undervalued |
-22.82% |
26.95 |
|
0.80% |
-5.53% |
-12.90% |
19.39% undervalued |
-45.50% |
19.94 |
|
-0.26% |
-1.26% |
-9.57% |
22.18% undervalued |
-25.31% |
10.91 |
ValuEngine.com is an independent research provider, producing buy/hold/sell recommendations, target price, and valuations on over 7,000 US and Canadian equities every trading day.
Visit www.ValuEngine.com for more information

|


