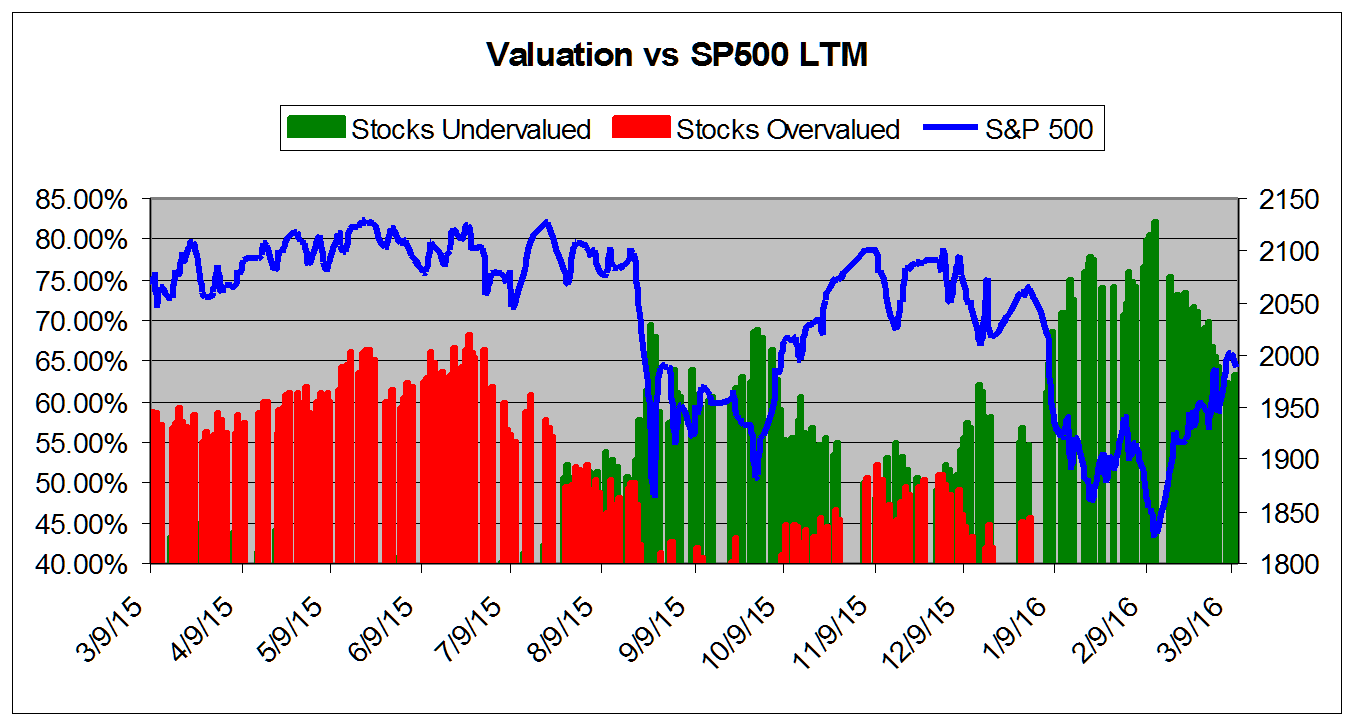
March 10, 2016VALUATION WATCH: Overvalued stocks now make up 36.86% of our stocks assigned a valuation and 11.05% of those equities are calculated to be overvalued by 20% or more. Four sectors are calculated to be overvalued. Rising UpValuations Hover Just Below Normal RangeValuEngine tracks more than 7000 US equities, ADRs, and foreign stock which trade on US exchanges as well as @1000 Canadian equities. When EPS estimates are available for a given equity, our model calculates a level of mispricing or valuation percentage for that equity based on earnings estimates and what the stock should be worth if the market were totally rational and efficient--an academic exercise to be sure, but one which allows for useful comparisons between equities, sectors, and industries. Using our Valuation Model, we can currently assign a VE valuation calculation to more than 2800 stocks in our US Universe. We combine all of the equities with a valuation calculation to track market valuation figures and use them as a metric for making calls about the overall state of the market. Two factors can lower these figures-- a market pullback, or a significant rise in EPS estimates. Vice-versa, a significant rally or reduction in EPS can raise the figure. Whenever we see overvaluation levels in excess of @ 65% for the overall universe and/or 27% for the overvalued by 20% or more categories, we issue a valuation warning. We now calculate that 36.86% of the stocks we can assign a valuation are overvalued and 11.05% of those stocks are overvalued by 20% or more. These numbers have recovered a bit along with the market rally since the earlier "unpleasantness" of 2016. We are now showing stocks that have recovered in value, are less cheap than last month, and also hovering very close to "normal" range--between 40-60%. 2016 has been a challenge for investors. markets have recovered somewhat over the past month, but are still down between 2-8% (SP500, DOW, and NASDAQ). We have been in a seven-year up market--almost the entirety of the Obama administration--and thus we have a rally that is long-in-the-tooth despite a continuing drumbeat of decent news from the US economy--labor market, housing, autos, etc. The chart below tracks the valuation metrics from February 2015. It shows levels in excess of 40%.
This chart shows overall universe over valuation in excess of 40% vs the S&P 500 from February 2013
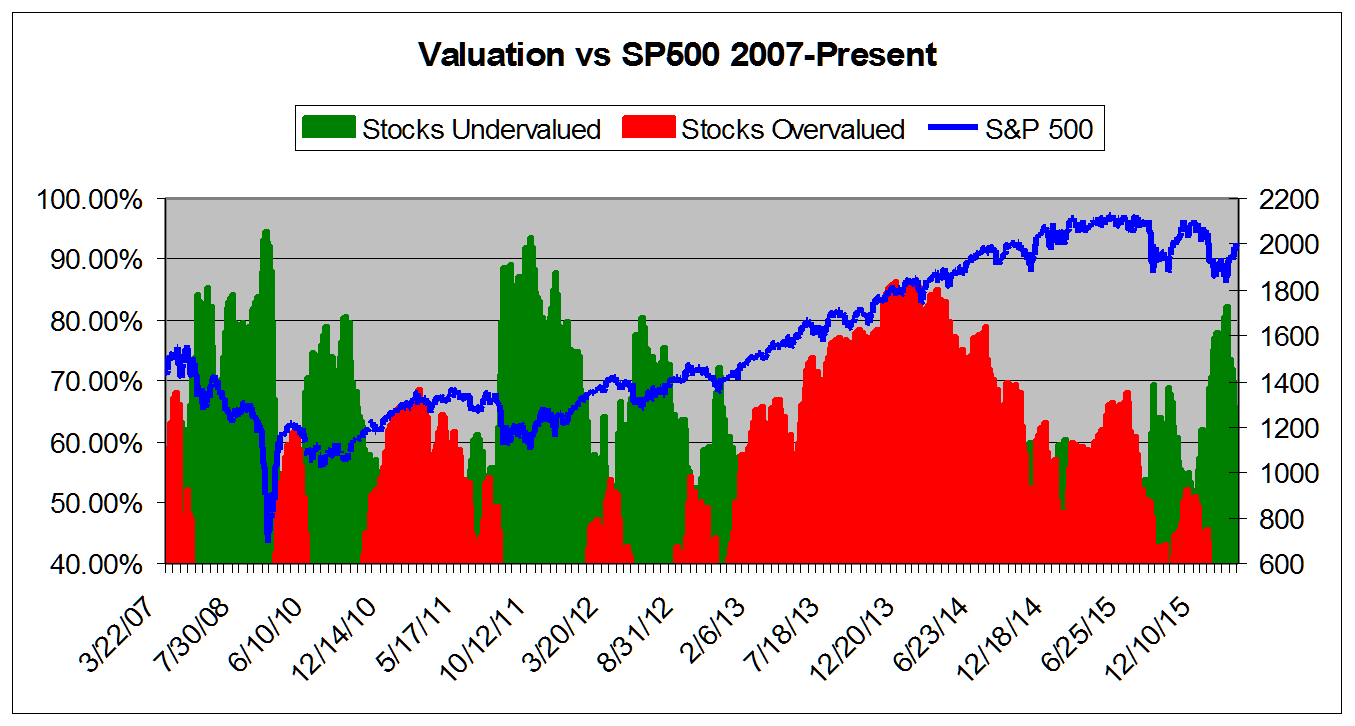
This chart shows overall universe under and over valuation in excess of 40% vs the S&P 500 from March 2007*
ValuEngine Market Overview
ValuEngine Sector Overview
ValuEngine.com is an independent research provider, producing buy/hold/sell recommendations, target price, and valuations on over 7,000 US and Canadian equities every trading day.
Visit www.ValuEngine.com for more information
|
|||||||||||||||||||||||||||||||||||||||||||||||||||||||||||||||||||||||||||||||||||||||||||||||||||||||||||||||||||||||||||||||||||