April 6, 2016
VALUATION WATCH: Overvalued stocks now make up 36.07% of our stocks assigned a valuation and 10.79% of those equities are calculated to be overvalued by 20% or more. Five sectors are calculated to be overvalued.
Skids Are Greased?
--ValuEngine Ranks and Rates Oil Industry Stocks
ValuEngine tracks more than 7000 US equities, ADRs, and foreign stock which trade on US exchanges as well as @1000 Canadian equities. When EPS estimates are available for a given equity, our model calculates a level of mispricing or valuation percentage for that equity based on earnings estimates and what the stock should be worth if the market were totally rational and efficient--an academic exercise to be sure, but one which allows for useful comparisons between equities, sectors, and industries. Using our Valuation Model, we can currently assign a VE valuation calculation to more than 2800 stocks in our US Universe.
Don't look now, but we are seeing some decent signs of a recovery in the Energy sector and commodities more generally. Crude prices jumped today on news of a diminishing US stockpile. Of course, given the fact that last week saw news that the glut of crude within the US was at its highest level in 80 years, a decline in inventories was fairly likely. Still, we got a @5% pop in May futures today.
Despite the Northeast's reversion to colder weather over the past few days, demand has increased for crude as the Summer driving season approaches. Refiners are working feverishly to make the gas that will fuel everyone's Summer vacation/travel driving. That demand increase has impacted the stockpiles.
The question is, can this rally be sustained? Prices are definitely higher than they were just two months ago-- when analysts last called a bottom in the crude market. At that time a barrel was @$30. We still need to see some more sustained growth globally in order to say the worst has past for Oil stocks. Also, we could see a boost in prices if producers in consortiums like OPEC really follow through on their efforts to limit production.
Obviously, if you are looking to buy low, oil is up, but currently still near its multi-year lows. So, if you're looking for cheap energy/oil stocks, time may be running out. It all depends on how producers manage production and how fast global growth--especially in China--can bounce back. And, as always, some firms are situated better within the sector. Consider refiners, they are running at almost max capacity, so there is one area where we know business is quite strong.
For today's bulletin we used our website's advanced screening functions to query our systems for the various oil-related industries in the Energy Sector. We find the following data for top-five lists of various categories.
Top-Five Oil and Gas Industry Stocks--Short-Term Forecast Returns
Ticker |
Name |
Mkt Price |
Valuation (%) |
VE Rating |
Last 12-M Return (%) |
BAK |
BRASKEM SA |
12.5 |
-35.69% |
5 |
61.08% |
VLO |
VALERO ENERGY |
63.14 |
-8.78% |
5 |
6.06% |
PSX |
PHILLIPS 66 |
84.81 |
14.32% |
5 |
7.97% |
PBF |
PBF ENERGY INC |
32.53 |
-2.36% |
4 |
1.59% |
TSO |
TESORO CORP |
82.71 |
-7.76% |
4 |
-4.55% |
Top-Five Oil and Gas Industry Stocks--Most Undervalued
Ticker |
Name |
Mkt Price |
Valuation (%) |
VE Rating |
Last 12-M Return (%) |
SDLP |
SEADRILL PTNRS |
3.3 |
-75.00% |
3 |
-74.96% |
AROC |
ARCHROCK INC |
6.64 |
-73.68% |
2 |
-80.67% |
ETE |
ENERGY TRAN EQT |
6.45 |
-72.48% |
3 |
-79.81% |
AMID |
AMER MIDSTREAM |
6.23 |
-67.82% |
2 |
-63.93% |
BTE |
BAYTEX ENERGY |
3.7 |
-67.48% |
1 |
-78.45% |
Top-Five Oil and Gas Industry Stocks--Most Overvalued
Ticker |
Name |
Mkt Price |
Valuation (%) |
VE Rating |
Last 12-M Return (%) |
WLL |
WHITING PETROLM |
7.74 |
300.00% |
1 |
-77.75% |
COG |
CABOT OIL & GAS |
22.32 |
94.14% |
2 |
-26.80% |
CLR |
CONTL RESOURCES |
29.49 |
82.65% |
2 |
-39.61% |
SYRG |
SYNERGY RES CP |
7.41 |
75.74% |
2 |
-40.24% |
TESO |
TESCO CORP |
8.04 |
74.71% |
2 |
-29.35% |
Top-Five Oil and Gas Industry Stocks--Composite Score
Ticker |
Name |
Mkt Price |
Valuation (%) |
VE Rating |
Last 12-M Return (%) |
BAK |
BRASKEM SA |
12.5 |
-35.69% |
5 |
61.08% |
VLO |
VALERO ENERGY |
63.14 |
-8.78% |
5 |
6.06% |
TSO |
TESORO CORP |
82.71 |
-7.76% |
4 |
-4.55% |
RDC |
ROWAN COS PLC |
15.94 |
-34.96% |
4 |
-17.32% |
PBF |
PBF ENERGY INC |
32.53 |
-2.36% |
4 |
1.59% |
Top-Five Oil and Gas Industry Stocks--Momentum
Ticker |
Name |
Mkt Price |
Valuation (%) |
VE Rating |
Last 12-M Return (%) |
BAK |
BRASKEM SA |
12.5 |
-35.69% |
5 |
61.08% |
POWR |
POWERSECURE INT |
18.67 |
17.77% |
3 |
43.62% |
PE |
PARSLEY ENGY-A |
21.76 |
N/A |
3 |
24.70% |
PSX |
PHILLIPS 66 |
84.81 |
14.32% |
5 |
7.97% |
PDCE |
PDC ENERGY INC |
58.5 |
55.03% |
3 |
7.20% |
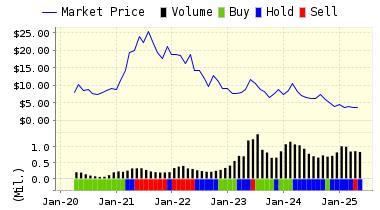
Below is today's data on Braskem (SA):
Braskem SA figures as the largest petrochemical operation in Latin America and among the five largest private companies in Brazil. With industrial facilities located in Alagoas, Bahia, Sao Paulo and Rio Grande do Sul, Braskem produces primary base petrochemicals such as ethylene, propylene, benzene, caprolactam, DMT and termoplastic resins (polypropylene, polyethylene, PVC and PET) gas and GLP.
ValuEngine continues its STRONG BUY recommendation on BRASKEM SA for 2016-04-05. Based on the information we have gathered and our resulting research, we feel that BRASKEM SA has the probability to OUTPERFORM average market performance for the next year. The company exhibits ATTRACTIVE P/E Ratio and Momentum.
You can download a free copy of detailed report on BAK from the link below.
ValuEngine Forecast |
| |
Target
Price* |
Expected
Return |
1-Month |
12.71 |
1.71% |
3-Month |
12.67 |
1.34% |
6-Month |
12.70 |
1.62% |
1-Year |
15.10 |
20.77% |
2-Year |
11.06 |
-11.50% |
3-Year |
6.65 |
-46.76% |
Valuation & Rankings |
Valuation |
35.69% undervalued |
|
 86 86 |
1-M Forecast Return |
1.71% |
1-M Forecast Return Rank |
100 |
12-M Return |
61.08% |
|
97 |
Sharpe Ratio |
-0.31 |
|
38 |
5-Y Avg Annual Return |
-14.70% |
5-Y Avg Annual Rtn Rank |
35 |
Volatility |
47.99% |
|
38 |
Expected EPS Growth |
-63.77% |
|
5 |
Market Cap (billions) |
4.98 |
Size Rank |
85 |
Trailing P/E Ratio |
4.40 |
|
99 |
Forward P/E Ratio |
12.14 |
Forward P/E Ratio Rank |
67 |
PEG Ratio |
n/a |
PEG Ratio Rank |
n/a |
Price/Sales |
0.33 |
|
87 |
Market/Book |
12.20 |
|
10 |
Beta |
2.11 |
Beta Rank |
10 |
Alpha |
0.63 |
Alpha Rank |
98 |

DOWNLOAD A FREE SAMPLE OF OUR BRASKEM (SA) REPORT BY CLICKING HERE
ValuEngine Market Overview
Summary of VE Stock Universe |
Stocks Undervalued |
63.93% |
Stocks Overvalued |
36.07% |
Stocks Undervalued by 20% |
28.19% |
Stocks Overvalued by 20% |
10.79% |
ValuEngine Sector Overview
|
|
|
|
|
|
|
|
-0.77% |
-0.84% |
3.45% |
7.66% overvalued |
-4.07% |
23.91 |
|
-1.48% |
-2.27% |
4.57% |
5.37% overvalued |
-3.57% |
22.45 |
|
-0.33% |
-1.46% |
15.23% |
3.69% overvalued |
-7.01% |
25.56 |
|
-1.26% |
-2.43% |
2.10% |
0.21% overvalued |
-11.72% |
16.80 |
|
-0.78% |
-1.23% |
1.36% |
0.01% overvalued |
-9.73% |
21.90 |
|
-0.94% |
-1.63% |
2.23% |
1.34% undervalued |
-14.75% |
18.80 |
|
-0.90% |
-1.41% |
3.00% |
5.26% undervalued |
-9.25% |
26.84 |
|
-0.39% |
-1.15% |
12.61% |
5.50% undervalued |
-5.87% |
21.36 |
|
-0.35% |
-0.18% |
-3.13% |
5.67% undervalued |
-12.56% |
19.69 |
|
-1.01% |
-1.23% |
-2.72% |
5.93% undervalued |
-8.63% |
15.68 |
|
-0.76% |
-1.42% |
0.73% |
6.22% undervalued |
-11.04% |
24.07 |
|
-0.80% |
-2.04% |
-1.30% |
8.16% undervalued |
-14.74% |
22.17 |
|
-0.67% |
-4.07% |
-2.91% |
11.30% undervalued |
-40.54% |
22.70 |
|
-1.28% |
-3.69% |
-2.17% |
12.29% undervalued |
-19.12% |
11.84 |
|
-1.31% |
0.40% |
-7.02% |
13.99% undervalued |
-21.23% |
25.57 |
|
-0.73% |
-1.96% |
-0.51% |
14.84% undervalued |
-29.24% |
13.08 |
ValuEngine.com is an independent research provider, producing buy/hold/sell recommendations, target price, and valuations on over 7,000 US and Canadian equities every trading day.
Visit www.ValuEngine.com for more information

|


