May 5, 2016
VALUATION WATCH: Overvalued stocks now make up 41.87% of our stocks assigned a valuation and 12.99% of those equities are calculated to be overvalued by 20% or more. Five sectors are calculated to be overvalued.
If you cannot display this bulletin properly, GO HERE
Indexing
--ValuEngine Rates and Ranks the DOW
ValuEngine tracks more than 7000 US equities, ADRs, and foreign stock which trade on US exchanges as well as @1000 Canadian equities. When EPS estimates are available for a given equity, our model calculates a level of mispricing or valuation percentage for that equity based on earnings estimates and what the stock should be worth if the market were totally rational and efficient--an academic exercise to be sure, but one which allows for useful comparisons between equities, sectors, and industries. Using our Valuation Model, we can currently assign a VE valuation calculation to more than 2800 stocks in our US Universe.
We also use trading data to provide forecast estimates for a variety of time horizons for almost ever equity in our database. Our Buy/Sell/Hold recommendations are based upon the 1-year forecast return figure. Using valuation and forecast figures, you can rank and rate our covered stocks against each other, to find out, in an objective and systematic way, the most attractive investment targets based on your own risk/reward parameters. We re-calculate the entire database every trading day, so you are assured that every proprietary valuation and forecast datapoint is as up-to-date as possible.
We can use our data to track individual stocks, industries, sectors, and indices. For today's bulletin, we present key metrics for the top picks in the Dow Jones Industrials. The companies listed below represent the top stocks within the index. They are presented below according to their one-month forecast gain.
Traveler's Insurance remains the overall leader--as it has for several months. Since the last time we presented the top Dow picks, Verizon retains its second-place position, but it is too soon to tell how the strike will effect the bottom line.Johnson and Johnson, Nike, and McDonald's haver moved up. JPMorgan declined yet again. United Health, Home Depot, Pfizer, and GE are new this month. Intel, Microsoft, Cisco, and IBM have fallen out of the top ten. Not a good month for tech?
Ticker |
Company Name |
Market Price |
Valuation |
Last 12-M Retrn |
1-M Forecast Retn |
1-Yr Forecast Retn |
P/E Ratio |
Sector Name |
February 18, 2016 |
TRV |
TRAVELERS COS |
109.73 |
-3.40% |
7.40% |
1.09% |
13.07% |
10.34 |
Finance |
TRV |
VZ |
VERIZON COMM |
50.84 |
-2.49% |
0.63% |
0.70% |
8.40% |
12.66 |
Utilities |
VZ |
JNJ |
JOHNSON & JOHNS |
112.22 |
4.05% |
11.83% |
0.62% |
7.43% |
17.79 |
Medical |
INTC |
UNH |
UNITEDHEALTH GP |
132.03 |
4.84% |
15.25% |
0.55% |
6.55% |
20.06 |
Medical |
JPM |
NKE |
NIKE INC-B |
59.11 |
-41.88% |
17.25% |
0.52% |
6.24% |
27.45 |
Consumer Discretionary |
MSFT |
MCD |
MCDONALDS CORP |
129.33 |
28.49% |
34.54% |
0.50% |
5.97% |
24.81 |
Retail-Wholesale |
CSCO |
JPM |
JPMORGAN CHASE |
61.57 |
3.54% |
-4.87% |
0.47% |
5.61% |
11.16 |
Finance |
JNJ |
HD |
HOME DEPOT |
135.16 |
6.34% |
22.81% |
0.46% |
5.46% |
24.31 |
Retail-Wholesale |
MCD |
PFE |
PFIZER INC |
33.4 |
6.19% |
-2.68% |
0.37% |
4.50% |
14.11 |
Medical |
NKE |
GE |
GENL ELECTRIC |
30.07 |
28.21% |
10.27% |
0.30% |
3.63% |
21.53 |
Multi-Sector Conglomerates |
IBM |
NOTE: New stocks are in BOLD, old stocks that have moved up the list are in GREEN, old stocks that have declined in position are in RED, and stocks which have retained their position are in CAPS.
NOTE ALSO: GE and Pfizer are not currently rated a "BUY."
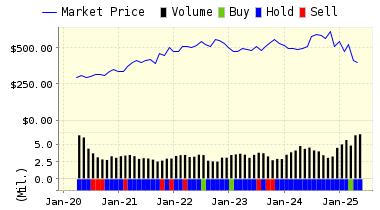
Below is today's data on United Health (UNH):
UnitedHealth Group Inc. offers health care coverage and related services to help people achieve improved health and well-being through all stages of life. The company's products and services reflect a number of core capabilities, including medical information management, health benefit administration, care coordination, risk assessment and pricing, health benefit design and provider contracting. With these capabilities, it is able to provide comprehensive health care management services through organized health systems and insurance products.
VALUENGINE RECOMMENDATION: ValuEngine continues its BUY recommendation on UNITEDHEALTH GP for 2016-05-04. Based on the information we have gathered and our resulting research, we feel that UNITEDHEALTH GP has the probability to OUTPERFORM average market performance for the next year. The company exhibits ATTRACTIVE Company Size and Sharpe Ratio.
You can download a free copy of detailed report on United Health from the link below.
ValuEngine Forecast |
| |
Target
Price* |
Expected
Return |
1-Month |
132.75 |
0.55% |
3-Month |
134.46 |
1.84% |
6-Month |
136.39 |
3.30% |
1-Year |
140.68 |
6.55% |
2-Year |
147.05 |
11.38% |
3-Year |
148.44 |
12.43% |
Valuation & Rankings |
Valuation |
4.84% overvalued |
|
 32 32 |
1-M Forecast Return |
0.55% |
1-M Forecast Return Rank |
86 |
12-M Return |
15.25% |
|
85 |
Sharpe Ratio |
1.19 |
|
99 |
5-Y Avg Annual Return |
19.68% |
5-Y Avg Annual Rtn Rank |
93 |
Volatility |
16.60% |
|
82 |
Expected EPS Growth |
24.51% |
|
63 |
Market Cap (billions) |
126.72 |
Size Rank |
100 |
Trailing P/E Ratio |
20.06 |
|
58 |
Forward P/E Ratio |
16.11 |
Forward P/E Ratio Rank |
46 |
PEG Ratio |
0.82 |
PEG Ratio Rank |
49 |
Price/Sales |
0.76 |
|
72 |
Market/Book |
3.61 |
|
31 |
Beta |
0.59 |
Beta Rank |
64 |
Alpha |
0.17 |
Alpha Rank |
86 |

DOWNLOAD A FREE SAMPLE OF OUR UNITED HEALTH CARE (UNH) REPORT BY CLICKING HERE
ValuEngine Market Overview
Summary of VE Stock Universe |
Stocks Undervalued |
58.13% |
Stocks Overvalued |
41.87% |
Stocks Undervalued by 20% |
24.65% |
Stocks Overvalued by 20% |
12.99% |
ValuEngine Sector Overview
|
|
|
|
|
|
|
|
0.21% |
-0.25% |
6.76% |
8.65% overvalued |
-1.72% |
24.87 |
|
-1.33% |
-3.71% |
28.80% |
8.53% overvalued |
6.58% |
28.10 |
|
-0.05% |
-0.46% |
5.30% |
6.92% overvalued |
-2.24% |
23.54 |
|
-0.56% |
-1.73% |
5.20% |
5.98% overvalued |
-10.94% |
20.37 |
|
-0.53% |
-0.33% |
4.69% |
2.39% overvalued |
-5.77% |
17.01 |
|
0.04% |
-0.16% |
-2.46% |
0.16% undervalued |
-8.01% |
17.71 |
|
-1.03% |
-4.99% |
6.95% |
1.73% undervalued |
-38.58% |
22.71 |
|
-0.27% |
-0.85% |
0.31% |
3.44% undervalued |
-6.37% |
15.73 |
|
-0.19% |
-1.31% |
16.75% |
3.73% undervalued |
-4.31% |
20.66 |
|
-0.56% |
-1.03% |
7.29% |
4.68% undervalued |
-10.37% |
22.03 |
|
-0.81% |
-1.26% |
4.44% |
4.83% undervalued |
-9.07% |
26.47 |
|
-0.72% |
-1.05% |
1.24% |
7.03% undervalued |
-10.88% |
23.26 |
|
-1.20% |
-1.69% |
-5.33% |
8.63% undervalued |
-20.95% |
25.77 |
|
-0.66% |
-1.09% |
-1.32% |
10.16% undervalued |
-15.39% |
22.45 |
|
-1.17% |
-2.78% |
1.98% |
12.43% undervalued |
-28.69% |
13.26 |
|
-1.09% |
-2.46% |
-1.06% |
12.86% undervalued |
-18.20% |
12.39 |
ValuEngine.com is an independent research provider, producing buy/hold/sell recommendations, target price, and valuations on over 7,000 US and Canadian equities every trading day.
Visit www.ValuEngine.com for more information

|


