May 10, 2016
VALUATION WATCH: Overvalued stocks now make up 41.55% of our stocks assigned a valuation and 13.23% of those equities are calculated to be overvalued by 20% or more. Six sectors are calculated to be overvalued.
If you cannot display this bulletin properly, GO HERE
Number One
--Fair Isaac Inc Is ValuEngine Top Stock
ValuEngine tracks more than 7000 US equities, ADRs, and foreign stock which trade on US exchanges as well as @1000 Canadian equities. When EPS estimates are available for a given equity, our model calculates a level of mispricing or valuation percentage for that equity based on earnings estimates and what the stock should be worth if the market were totally rational and efficient--an academic exercise to be sure, but one which allows for useful comparisons between equities, sectors, and industries. Using our Valuation Model, we can currently assign a VE valuation calculation to more than 2800 stocks in our US Universe.
We combine all of the equities with a valuation calculation to track market valuation figures and use them as a metric for making calls about the overall state of the market. Two factors can lower these figures-- a market pullback, or a significant rise in EPS estimates.
We also use trading data to provide forecast estimates for a variety of time horizons for almost ever equity in our database. Our Buy/Sell/Hold recommendations are based upon the 1-year forecast return figure. Using valuation and forecast figures, you can rank and rate our covered stocks against each other, to find out, in an objective and systematic way, the most attractive investment targets based on your own risk/reward parameters. We re-calculate the entire database every trading day, so you are assured that every proprietary valuation and forecast datapoint is as up-to-date as possible.
So, for today's bulletin we used our website's advanced screening functions to search for the top-rated STRONG BUY US stock with valuation data that meets minimum liquidity requirements. Fair Isaac Inc (FICO) is the leader here.
Fair Isaac Corporation makes decisions smarter. The company's solutions and technologies for Enterprise Decision Management give businesses the power to automate more processes, and apply more intelligence to every customer interaction. Through increasing the precision, consistency and agility of their decisions, Fair Isaac clients worldwide increase sales, build customer value, cut fraud losses, manage credit risk, reduce operational costs, meet changing compliance demands and enter new markets more profitably. Fair Isaac powers hundreds of billions of decisions each year in financial services, insurance, telecommunications, retail, consumer branded goods, healthcare and the public sector.
ValuEngine updated its recommendation from BUY to STRONG BUY for FAIR ISAAC INC on 2016-05-09. Based on the information we have gathered and our resulting research, we feel that FAIR ISAAC INC has the probability to OUTPERFORM average market performance for the next year. The company exhibits ATTRACTIVE Sharpe Ratio and P/E Ratio.
You can download a free copy of detailed report on Fair Isaac from the link below.
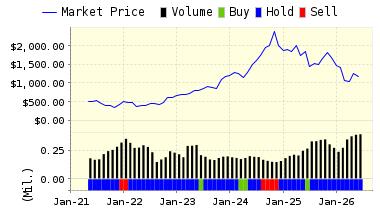
ValuEngine Forecast |
| |
Target
Price* |
Expected
Return |
1-Month |
109.39 |
1.58% |
3-Month |
108.54 |
0.79% |
6-Month |
107.38 |
-0.29% |
1-Year |
128.33 |
19.17% |
2-Year |
83.46 |
-22.50% |
3-Year |
36.00 |
-66.57% |
Valuation & Rankings |
Valuation |
75.00% undervalued |
|
 100 100 |
1-M Forecast Return |
1.58% |
1-M Forecast Return Rank |
100 |
12-M Return |
23.36% |
|
89 |
Sharpe Ratio |
0.94 |
|
97 |
5-Y Avg Annual Return |
25.46% |
5-Y Avg Annual Rtn Rank |
96 |
Volatility |
27.12% |
|
63 |
Expected EPS Growth |
74.75% |
|
83 |
Market Cap (billions) |
3.42 |
Size Rank |
81 |
Trailing P/E Ratio |
7.28 |
|
95 |
Forward P/E Ratio |
4.17 |
Forward P/E Ratio Rank |
98 |
PEG Ratio |
0.10 |
PEG Ratio Rank |
84 |
Price/Sales |
4.02 |
|
22 |
Market/Book |
8.03 |
|
14 |
Beta |
1.42 |
Beta Rank |
25 |
Alpha |
0.20 |
Alpha Rank |
87 |

DOWNLOAD A FREE SAMPLE OF OUR FAIR ISAAC (FICO) REPORT BY CLICKING HERE
ValuEngine Market Overview
Summary of VE Stock Universe |
Stocks Undervalued |
58.45% |
Stocks Overvalued |
41.55% |
Stocks Undervalued by 20% |
25.37% |
Stocks Overvalued by 20% |
13.23% |
ValuEngine Sector Overview
|
|
|
|
|
|
|
|
-0.05% |
-0.94% |
5.78% |
8.21% overvalued |
-1.03% |
24.71 |
|
-0.15% |
-0.25% |
5.46% |
8.12% overvalued |
-1.21% |
23.80 |
|
-3.80% |
-5.88% |
25.21% |
5.44% overvalued |
7.56% |
28.18 |
|
-0.92% |
-2.17% |
4.55% |
3.85% overvalued |
-11.99% |
20.33 |
|
-0.61% |
-1.21% |
3.50% |
1.58% overvalued |
-8.54% |
17.07 |
|
0.16% |
-0.40% |
-2.50% |
0.56% overvalued |
-6.97% |
17.94 |
|
-0.32% |
-0.88% |
17.10% |
2.25% undervalued |
-6.55% |
20.57 |
|
-0.01% |
-0.68% |
0.49% |
3.07% undervalued |
-6.31% |
15.80 |
|
0.28% |
-0.09% |
8.20% |
3.77% undervalued |
-9.84% |
21.70 |
|
-3.06% |
-7.59% |
4.39% |
4.25% undervalued |
-39.37% |
21.64 |
|
0.13% |
-0.32% |
2.46% |
4.54% undervalued |
-10.19% |
22.30 |
|
-0.38% |
-2.09% |
3.58% |
6.38% undervalued |
-10.24% |
26.00 |
|
0.72% |
-2.23% |
-5.68% |
8.54% undervalued |
-20.53% |
26.28 |
|
0.63% |
-1.17% |
-1.44% |
10.14% undervalued |
-14.68% |
22.41 |
|
-0.81% |
-3.20% |
-1.79% |
12.56% undervalued |
-17.45% |
11.57 |
|
-1.03% |
-3.78% |
0.87% |
13.01% undervalued |
-29.15% |
13.57 |
ValuEngine.com is an independent research provider, producing buy/hold/sell recommendations, target price, and valuations on over 7,000 US and Canadian equities every trading day.
Visit www.ValuEngine.com for more information

|


