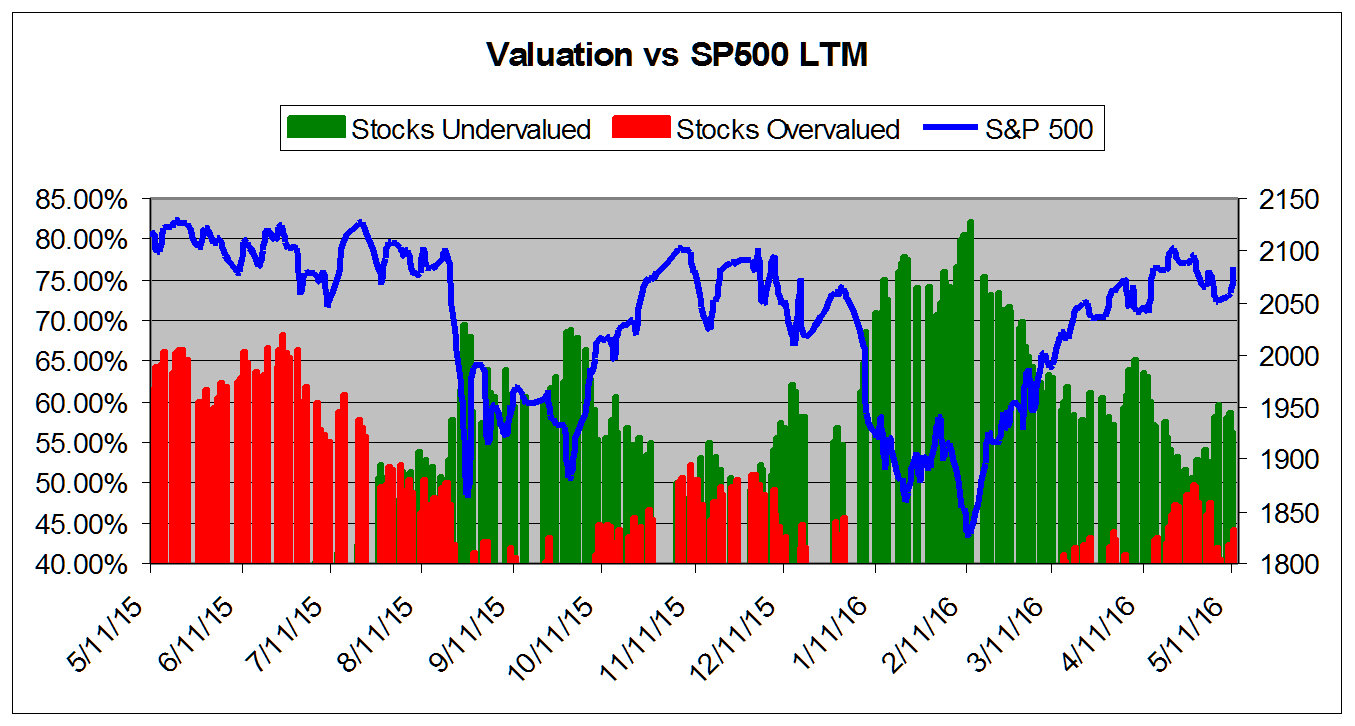
May 11, 2016VALUATION WATCH: Overvalued stocks now make up 44.04% of our stocks assigned a valuation and 14.36% of those equities are calculated to be overvalued by 20% or more. Six sectors are calculated to be overvalued. If you cannot display this bulletin properly, GO HERE Return to NormalcyValuations Recover From DipValuEngine tracks more than 7000 US equities, ADRs, and foreign stock which trade on US exchanges as well as @1000 Canadian equities. When EPS estimates are available for a given equity, our model calculates a level of mispricing or valuation percentage for that equity based on earnings estimates and what the stock should be worth if the market were totally rational and efficient--an academic exercise to be sure, but one which allows for useful comparisons between equities, sectors, and industries. Using our Valuation Model, we can currently assign a VE valuation calculation to more than 2800 stocks in our US Universe. We combine all of the equities with a valuation calculation to track market valuation figures and use them as a metric for making calls about the overall state of the market. Two factors can lower these figures-- a market pullback, or a significant rise in EPS estimates. Vice-versa, a significant rally or reduction in EPS can raise the figure. Whenever we see overvaluation levels in excess of @ 65% for the overall universe and/or 27% for the overvalued by 20% or more categories, we issue a valuation warning. We now calculate that 44.04% of the stocks we can assign a valuation are overvalued and 14.36% of those stocks are overvalued by 20% or more. These numbers have climbed back into "normal" range since we published our valuation study in April-- when the overvaluation was at 36.99%. And of course, we have the gorilla in the room, the US presidential election. Often these elections prove to be correlated with decent stock markets. But, we have some giant uncertainties thanks to the GOP-nomation of Donald Trump. What so many "experts" said was impossible has, in fact, now happened. Regardless, our valuation figures show a "normal" market. The chart below tracks the valuation metrics from April 2015. It shows levels in excess of 40%.
This chart shows overall universe over valuation in excess of 40% vs the S&P 500 from April 2013
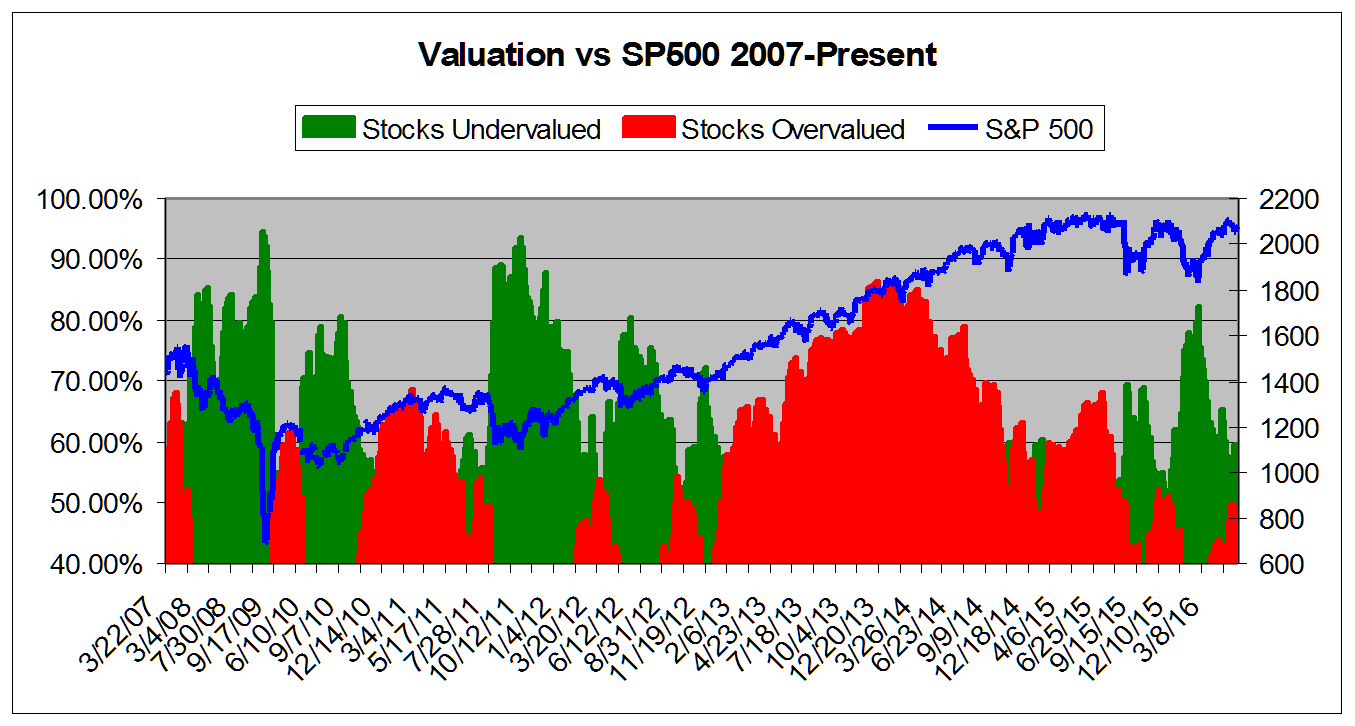
This chart shows overall universe under and over valuation in excess of 40% vs the S&P 500 from March 2007*
ValuEngine Market Overview
ValuEngine Sector Overview
ValuEngine.com is an independent research provider, producing buy/hold/sell recommendations, target price, and valuations on over 7,000 US and Canadian equities every trading day.
Visit www.ValuEngine.com for more information
|
|||||||||||||||||||||||||||||||||||||||||||||||||||||||||||||||||||||||||||||||||||||||||||||||||||||||||||||||||||||||||||||||||||