
May 17, 2016VALUATION WATCH: Overvalued stocks now make up 42.4% of our stocks assigned a valuation and 13.77% of those equities are calculated to be overvalued by 20% or more. Seven sectors are calculated to be overvalued. If you cannot display this bulletin properly, GO HERE No Place Like HomeHome Depot Earnings ReportHome Depot (HD) is the one of world's largest home improvement retailer. The company offers a level of service unprecedented among warehouse-style retailers. Home Depot stores cater to do-it-yourselfers, as well as home improvement, construction and building maintenance professionals. The Home Depot currently operates in the USA, Canada, Chile, Puerto Rico, and Argentina. The company also operates EXPO Design Centers across the U.S. and Villager's Hardware in New Jersey. Home Depot today reported sales of $22.8 billion for the first quarter of fiscal 2016, a 9.0 percent increase from the first quarter of fiscal 2015. Comparable store sales for the first quarter of fiscal 2016 were positive 6.5 percent, and comp sales for U.S. stores were positive 7.4 percent. Net earnings for the first quarter of fiscal 2016 were $1.8 billion, or $1.44 per diluted share, compared with net earnings of $1.6 billion, or $1.21 per diluted share, in the same period of fiscal 2015. For the first quarter of fiscal 2016, diluted earnings per share increased 19.0 percent from the same period in the prior year. "We were pleased with our stronger than expected start to the year, driven by solid execution and broad-based growth across the store," said Craig Menear, chairman, CEO and president. "This was made possible by our hard working associates and their continued dedication to our customers in a quarter marked by week-to-week demand spikes caused by weather variability." Good news for Home Depot is often good news for the housing market and the US economy more generally, as consumers use the giant for their home-improvement projects. Home Depot took the additional step of increasing their forecast for the rest of the year. The company now expects sales to increase 6.3 and for diluted earnings per share to increase @14.8% ($6.27/share) compared to fy 2015. ValuEngine continues its BUY recommendation on HOME DEPOT for 2016-05-16. Based on the information we have gathered and our resulting research, we feel that HOME DEPOT has the probability to OUTPERFORM average market performance for the next year. The company exhibits ATTRACTIVE Company Size and Sharpe Ratio. 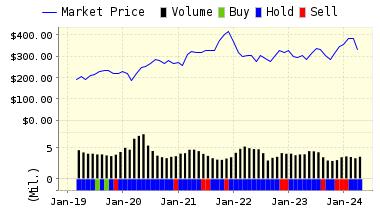
DOWNLOAD A FREE SAMPLE OF OUR HOME DEPOT (HD) REPORT BY CLICKING HERE
ValuEngine Market Overview
ValuEngine Sector Overview
ValuEngine.com is an independent research provider, producing buy/hold/sell recommendations, target price, and valuations on over 7,000 US and Canadian equities every trading day.
Visit www.ValuEngine.com for more information
|
|||||||||||||||||||||||||||||||||||||||||||||||||||||||||||||||||||||||||||||||||||||||||||||||||||||||||||||||||||||||||||||||||||||||||||||||||||||||||||||||||||||||||||||||||||||||||||||||||||||||||||||||||||||||||||


