May 19, 2016
VALUATION WATCH: Overvalued stocks now make up 41.78% of our stocks assigned a valuation and 13.62% of those equities are calculated to be overvalued by 20% or more. Six sectors are calculated to be overvalued.
If you cannot display this bulletin properly, GO HERE
Indexing
--ValuEngine Rates and Ranks the NASDAQ
ValuEngine tracks more than 7000 US equities, ADRs, and foreign stock which trade on US exchanges as well as @1000 Canadian equities. When EPS estimates are available for a given equity, our model calculates a level of mispricing or valuation percentage for that equity based on earnings estimates and what the stock should be worth if the market were totally rational and efficient--an academic exercise to be sure, but one which allows for useful comparisons between equities, sectors, and industries. Using our Valuation Model, we can currently assign a VE valuation calculation to more than 2800 stocks in our US Universe.
We also use trading data to provide forecast estimates for a variety of time horizons for almost ever equity in our database. Our Buy/Sell/Hold recommendations are based upon the 1-year forecast return figure. Using valuation and forecast figures, you can rank and rate our covered stocks against each other, to find out, in an objective and systematic way, the most attractive investment targets based on your own risk/reward parameters. We re-calculate the entire database every trading day, so you are assured that every proprietary valuation and forecast datapoint is as up-to-date as possible.
We can use our data to track individual stocks, industries, sectors, and indices. For today's bulletin, we present key metrics for the top picks in the NASDAQ 100. The companies listed below represent the top-ten BUY and STRONG BUY stocks within the index. They are presented below according to their one-month forecast target prices.
We have some turnover here, with four newcomers in CA Inc, Facebook, Comcast, and Google/Alphabet. LAM Research has declined from second to ninth. Activision and Cirix have moved up three positions each. INTC, AMAT, and GILD have left the top-ten list since the last time we presented the top NASDAQ picks at the end of April. Broadcom has retained its position as the top NASDAQ stock. Once again, the list is dominated by tech companies--as is often the case with the NASDAQ.
Ticker |
Company Name |
Market Price |
Valuation |
Last 12-M Retrn |
1-M Forecast Retn |
1-Yr Forecast Retn |
P/E Ratio |
Sector |
4-28-2016 Leaders |
AVGO |
BROADCOM LTD |
143.88 |
-8.68% |
10.52% |
0.78% |
9.32% |
16.71 |
Computer and Technology |
AVGO |
CTXS |
CITRIX SYS INC |
82.74 |
1.62% |
25.52% |
0.72% |
8.61% |
19.72 |
Computer and Technology |
LRCX |
NTES |
NETEASE INC |
163.56 |
16.30% |
15.74% |
0.70% |
8.44% |
17.12 |
Computer and Technology |
NTES |
GOOG |
ALPHABET INC-C |
706.63 |
N/A |
32.75% |
0.53% |
6.40% |
29.72 |
Computer and Technology |
GILD |
CMCSA |
COMCAST CORP A |
60.38 |
-4.68% |
5.99% |
0.52% |
6.28% |
18.35 |
Consumer Discretionary |
CTXS |
ATVI |
ACTIVISION BLZD |
38.47 |
17.85% |
51.34% |
0.51% |
6.10% |
27.94 |
Consumer Discretionary |
AMAT |
NVDA |
NVIDIA CORP |
43.36 |
57.59% |
103.86% |
0.51% |
6.09% |
30.97 |
Computer and Technology |
NVDA |
FB |
FACEBOOK INC-A |
117.65 |
-10.85% |
45.46% |
0.48% |
5.73% |
61.06 |
Computer and Technology |
CSCO |
LRCX |
LAM RESEARCH |
73.97 |
-12.05% |
-6.91% |
0.47% |
5.60% |
12.09 |
Computer and Technology |
ATVI |
CA |
CA INC |
31.36 |
13.36% |
-1.23% |
0.46% |
5.54% |
13.84 |
Computer and Technology |
INTC |
NOTE: New stocks are in BOLD, old stocks that have moved up the list are in GREEN, old stocks that have declined in position are in RED, and stocks which have retained their position are in CAPS.
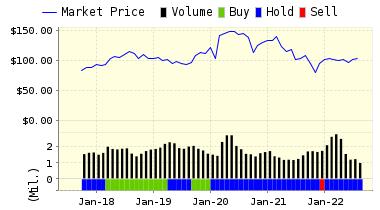
Below is today's data on CITRIX SYSYTEMS (CTXS):
Citrix Systems, Inc. is one of the leading suppliers of application delivery and management software and services that enable the effective and efficient enterprise-wide deployment and management of applications. The company's products permit organizations to deploy and manage applications without regard to location, network connection, or type of client hardware platform.
VALUENGINE RECOMMENDATION: ValuEngine continues its BUY recommendation on CITRIX SYS INC for 2016-05-18. Based on the information we have gathered and our resulting research, we feel that CITRIX SYS INC has the probability to OUTPERFORM average market performance for the next year. The company exhibits ATTRACTIVE Company Size and Momentum.
You can download a free copy of detailed report on CTXS from the link below.
ValuEngine Forecast |
| |
Target
Price* |
Expected
Return |
1-Month |
83.34 |
0.72% |
3-Month |
84.01 |
1.54% |
6-Month |
84.68 |
2.34% |
1-Year |
89.87 |
8.61% |
2-Year |
89.52 |
8.19% |
3-Year |
86.91 |
5.04% |
Valuation & Rankings |
Valuation |
1.62% overvalued |
|
 39 39 |
1-M Forecast Return |
0.72% |
1-M Forecast Return Rank |
92 |
12-M Return |
25.52% |
|
90 |
Sharpe Ratio |
-0.02 |
|
55 |
5-Y Avg Annual Return |
-0.60% |
5-Y Avg Annual Rtn Rank |
54 |
Volatility |
35.01% |
|
51 |
Expected EPS Growth |
-2.38% |
|
23 |
Market Cap (billions) |
13.32 |
Size Rank |
93 |
Trailing P/E Ratio |
19.72 |
|
58 |
Forward P/E Ratio |
20.20 |
Forward P/E Ratio Rank |
28 |
PEG Ratio |
n/a |
PEG Ratio Rank |
n/a |
Price/Sales |
3.99 |
|
22 |
Market/Book |
6.44 |
|
18 |
Beta |
1.83 |
Beta Rank |
14 |
Alpha |
0.22 |
Alpha Rank |
88 |

DOWNLOAD A FREE SAMPLE OF OUR CITRIX SYSTEMS (CTXS) REPORT BY CLICKING HERE
ValuEngine Market Overview
Summary of VE Stock Universe |
Stocks Undervalued |
58.22% |
Stocks Overvalued |
41.78% |
Stocks Undervalued by 20% |
25.75% |
Stocks Overvalued by 20% |
13.62% |
ValuEngine Sector Overview
|
|
|
|
|
|
|
|
-0.91% |
-2.66% |
3.93% |
6.74% overvalued |
-3.22% |
22.57 |
|
-0.50% |
-1.89% |
3.83% |
6.05% overvalued |
-2.99% |
23.52 |
|
-2.75% |
-6.43% |
25.03% |
4.96% overvalued |
12.70% |
28.14 |
|
0.01% |
-2.17% |
2.67% |
3.87% overvalued |
-10.58% |
17.05 |
|
-0.17% |
-3.52% |
2.99% |
1.70% overvalued |
-12.73% |
19.99 |
|
-0.06% |
-1.12% |
-3.94% |
0.70% overvalued |
-8.90% |
18.85 |
|
-1.28% |
-4.87% |
10.41% |
0.88% undervalued |
-35.19% |
21.71 |
|
0.59% |
-1.16% |
0.01% |
2.04% undervalued |
-6.65% |
15.74 |
|
-0.22% |
-2.19% |
16.73% |
2.54% undervalued |
-5.94% |
20.34 |
|
0.20% |
-2.95% |
2.61% |
4.09% undervalued |
-11.41% |
25.75 |
|
0.20% |
-0.82% |
8.31% |
4.42% undervalued |
-8.86% |
22.10 |
|
-0.39% |
-2.68% |
-0.26% |
6.19% undervalued |
-12.88% |
21.06 |
|
-0.05% |
-5.64% |
-4.55% |
8.78% undervalued |
-19.04% |
11.50 |
|
0.23% |
-4.55% |
-7.44% |
9.42% undervalued |
-21.55% |
26.25 |
|
-1.50% |
-6.19% |
-1.58% |
14.10% undervalued |
-31.14% |
12.90 |
|
-0.75% |
-6.09% |
-6.19% |
14.63% undervalued |
-17.11% |
21.05 |
ValuEngine.com is an independent research provider, producing buy/hold/sell recommendations, target price, and valuations on over 7,000 US and Canadian equities every trading day.
Visit www.ValuEngine.com for more information

|


