June 13, 2016
VALUATION WATCH: Overvalued stocks now make up 43.35% of our stocks assigned a valuation and 14.55% of those equities are calculated to be overvalued by 20% or more. Seven sectors are calculated to be overvalued.
If you cannot display this bulletin properly, GO HERE
UPGRADES
--ValuEngine Top-Five BUY/STRONG BUY Upgrades
ValuEngine tracks more than 7000 US equities, ADRs, and foreign stock which trade on US exchanges as well as @1000 Canadian equities. When EPS estimates are available for a given equity, our model calculates a level of mispricing or valuation percentage for that equity based on earnings estimates and what the stock should be worth if the market were totally rational and efficient--an academic exercise to be sure, but one which allows for useful comparisons between equities, sectors, and industries. Using our Valuation Model, we can currently assign a VE valuation calculation to more than 2800 stocks in our US Universe.
We combine all of the equities with a valuation calculation to track market valuation figures and use them as a metric for making calls about the overall state of the market. Two factors can lower these figures-- a market pullback, or a significant rise in EPS estimates.
We also use trading data to provide forecast estimates for a variety of time horizons for almost ever equity in our database. Our Buy/Sell/Hold recommendations are based upon the 1-year forecast return figure. Using valuation and forecast figures, you can rank and rate our covered stocks against each other, to find out, in an objective and systematic way, the most attractive investment targets based on your own risk/reward parameters. We re-calculate the entire database every trading day, so you are assured that every proprietary valuation and forecast datapoint is as up-to-date as possible.
So, for today's bulletin we used our website's advanced screening functions to search for UPGRADES to BUY or STRONG BUY with complete forecast and valuation data. They are presented by one-month forecast return. JM Smuckers (SJM) is the leader here. Note: there were only four upgrades to BUY/STRONG BUY with full valaution and forecast data for the day.
Ticker |
Company Name |
Market Price |
Valuation |
Last 12-M Return |
1-M Forecast Return |
1-Yr Forecast Return |
P/E Ratio |
Sector Name |
SJM |
SMUCKER JM |
144.24 |
14.07% |
29.28% |
0.51% |
6.10% |
21.74 |
Consumer Staples |
SEP |
SPECTRA EGY PTR |
46.44 |
-13.37% |
-4.27% |
0.58% |
6.89% |
12.15 |
Oils-Energy |
SNH |
SENIOR HOUSING |
18.98 |
-17.94% |
5.50% |
1.16% |
13.93% |
10.02 |
Finance |
VER |
VEREIT INC |
9.81 |
-0.39% |
15.01% |
1.11% |
13.34% |
11.96 |
Finance |
N/A |
N/A |
N/A |
N/A |
N/A |
N/A |
N/A |
N/A |
N/A |
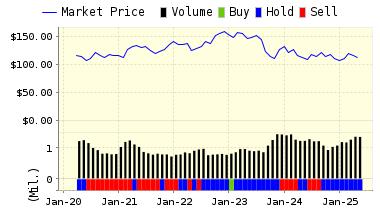
Below is today's data on JM Smuckers (SJM):
The J.M. Smucker Company, headquartered in Orrville, Ohio is the leading marketer of jams, jellies, preserves, and other fruit spreads in the U.S. They are also the leader in dessert toppings, natural peanut butter, and health and natural foods juice products, and market a wide variety of other specialty products throughout the U.S. and in many foreign countries. In the fruit spreads category, they also hold the leadership position in Australia and Canada.
VALUENGINE RECOMMENDATION: ValuEngine updated its recommendation from HOLD to BUY for SMUCKER JM on 2016-06-10. Based on the information we have gathered and our resulting research, we feel that SMUCKER JM has the probability to OUTPERFORM average market performance for the next year. The company exhibits ATTRACTIVE Company Size and Momentum.
You can download a free copy of detailed report on SJM from the link below.
ValuEngine Forecast |
| |
Target
Price* |
Expected
Return |
1-Month |
144.97 |
0.51% |
3-Month |
147.80 |
2.46% |
6-Month |
151.04 |
4.71% |
1-Year |
153.04 |
6.10% |
2-Year |
168.10 |
16.54% |
3-Year |
176.56 |
22.40% |
Valuation & Rankings |
Valuation |
14.07% overvalued |
|
 21 21 |
1-M Forecast Return |
0.51% |
1-M Forecast Return Rank |
85 |
12-M Return |
29.28% |
|
90 |
Sharpe Ratio |
0.65 |
|
90 |
5-Y Avg Annual Return |
9.76% |
5-Y Avg Annual Rtn Rank |
81 |
Volatility |
15.11% |
|
85 |
Expected EPS Growth |
-3.02% |
|
20 |
Market Cap (billions) |
14.68 |
Size Rank |
93 |
Trailing P/E Ratio |
21.74 |
|
55 |
Forward P/E Ratio |
22.42 |
Forward P/E Ratio Rank |
24 |
PEG Ratio |
n/a |
PEG Ratio Rank |
n/a |
Price/Sales |
1.97 |
|
45 |
Market/Book |
2.00 |
|
50 |
Beta |
0.53 |
Beta Rank |
66 |
Alpha |
0.09 |
Alpha Rank |
78 |

DOWNLOAD A FREE SAMPLE OF OUR JM SMUCKERS (SJM) REPORT BY CLICKING HERE
ValuEngine Market Overview
Summary of VE Stock Universe |
Stocks Undervalued |
56.65% |
Stocks Overvalued |
43.35% |
Stocks Undervalued by 20% |
24.73% |
Stocks Overvalued by 20% |
14.55% |
ValuEngine Sector Overview
|
|
|
|
|
|
|
|
-1.05% |
4.55% |
34.74% |
9.94% overvalued |
17.51% |
29.09 |
|
-1.19% |
0.72% |
5.57% |
8.14% overvalued |
3.24% |
23.61 |
|
-1.48% |
0.39% |
6.13% |
5.69% overvalued |
3.31% |
23.41 |
|
-1.30% |
0.39% |
4.97% |
3.55% overvalued |
-8.93% |
18.09 |
|
-2.66% |
2.25% |
12.47% |
2.83% overvalued |
-31.42% |
22.35 |
|
-1.70% |
1.10% |
6.73% |
2.03% overvalued |
-9.71% |
21.78 |
|
-1.36% |
-0.59% |
-2.77% |
0.18% overvalued |
-2.78% |
18.87 |
|
-1.47% |
0.16% |
7.09% |
2.19% undervalued |
-9.90% |
27.82 |
|
-1.01% |
0.86% |
11.99% |
2.23% undervalued |
-9.97% |
22.92 |
|
-0.94% |
-0.53% |
1.90% |
3.23% undervalued |
-4.92% |
15.92 |
|
-1.31% |
-0.17% |
2.36% |
3.79% undervalued |
-11.55% |
22.48 |
|
-1.55% |
-0.58% |
19.60% |
4.59% undervalued |
-4.09% |
20.80 |
|
-1.76% |
0.26% |
-5.13% |
7.37% undervalued |
-21.92% |
26.89 |
|
-1.94% |
-2.07% |
-2.34% |
9.77% undervalued |
-18.36% |
11.88 |
|
-1.88% |
0.46% |
2.53% |
10.95% undervalued |
-26.12% |
13.54 |
|
-1.33% |
-0.29% |
-3.76% |
11.64% undervalued |
-12.09% |
22.00 |
ValuEngine.com is an independent research provider, producing buy/hold/sell recommendations, target price, and valuations on over 7,000 US and Canadian equities every trading day.
Visit www.ValuEngine.com for more information

|


