
July 6, 2016VALUATION WATCH: Overvalued stocks now make up 33.67% of our stocks assigned a valuation and 11.57% of those equities are calculated to be overvalued by 20% or more. Three sectors are calculated to be overvalued. If you cannot display this bulletin properly, GO HERE Hot FlixComcast/Netflix Combine ForcesNetflix (NFLX) is the world's leading Internet television network with millions of subscribers in nearly 50 countries who have access to an ever-expanding library of TV shows and movies, including original programming, documentaries and feature films. The company offers the ability to watch as subscribers want, anytime, anywhere, on nearly any Internet-connected screen. Comcast Corp. (CMCSA), among the world's leading communication companies, provides basic cable, digital cable and high speed internet services that connect people to what's important in their lives. They are in the process of deploying digital video applications and high-speed Internet access service to expand the products available on their cable communications networks. This is good news for customers that have not "cut the cable" yet and eliminated Comcast from their media consumption pipeline. With Netflix and Comcast partnering up to push the new X1 boxes, we see a reduction in the hostility of recent years. It was not so long ago that Comcast engaged in speed reductions for Netflix content in an effort to derive more revenue from the services using their bandwidth. The deal should help Comcast get those X1 boxes out and may reduce the annoyance factor for those seeking any excuse to ditch the provider in lieu of internet-only service. Netflix may see a boost in subscribers, as the service will now be featured on the Comcast boxes. However, as of now analysts don't see a big gain for the Netflix bottom line from this benefit. Right now our models aren't particularly enamored of either company. We rate both a HOLD. However, that may change if there are big adjustments to earnings estimates as a result of this deal. ValuEngine continues its HOLD recommendation on NETFLIX INC for 2016-07-05. Based on the information we have gathered and our resulting research, we feel that NETFLIX INC has the probability to ROUGHLY MATCH average market performance for the next year. The company exhibits ATTRACTIVE Earnings Growth Rate but UNATTRACTIVE Volatility. 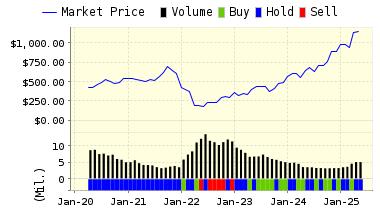
And here's our latest data on Comcast: ValuEngine continues its HOLD recommendation on COMCAST CORP A for 2016-07-05. Based on the information we have gathered and our resulting research, we feel that COMCAST CORP A has the probability to ROUGHLY MATCH average market performance for the next year. The company exhibits ATTRACTIVE Company Size but UNATTRACTIVE Book Market Ratio. 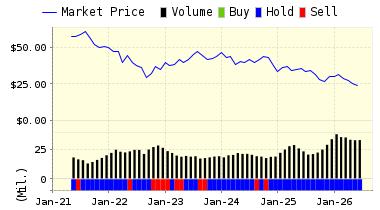
You can download our detailed valuation and forecast report on either company by clicking on the links below:
DOWNLOAD A FREE SAMPLE OF OUR COMCAST (CMSCA) REPORT BY CLICKING HERE
DOWNLOAD A FREE SAMPLE OF OUR NETFLIX (NFLX) REPORT BY CLICKING HERE
ValuEngine Market Overview
ValuEngine Sector Overview
ValuEngine.com is an independent research provider, producing buy/hold/sell recommendations, target price, and valuations on over 7,000 US and Canadian equities every trading day.
Visit www.ValuEngine.com for more information
|
|||||||||||||||||||||||||||||||||||||||||||||||||||||||||||||||||||||||||||||||||||||||||||||||||||||||||||||||||||||||||||||||||||||||||||||||||||||||||||||||||||||||||||||||||||||||||||||||||||||||||||||||||||||||||||||||||||||||||||||||||||||||||||||||||||||||||||||||||||||||||||||||||||||||||||||||||||


