June 29, 2016
VALUATION WATCH: Overvalued stocks now make up 40.51% of our stocks assigned a valuation and 13.57% of those equities are calculated to be overvalued by 20% or more. Four sectors are calculated to be overvalued.
If you cannot display this bulletin properly, GO HERE
Are You The Master?
Nintendo Stock Surges On Pokemon Go Craze
NINTENDO LTD is the acknowledged worldwide leader in the creation of interactive entertainment. Nintendo has created such industry icons as Mario and Donkey Kong and launched franchises like The Legend of Zelda and Pokemon. Nintendo manufactures and markets hardware and software for its popular home video game systems, including Nintendo 64 and Game Boy - the world's best-selling video game system.
Nintendo has been a name we have really heard much from in the world of video games and home console systems of late. However, that all changed over the past few days as the company's mobile app, Pokemon Go, has taken the world by storm.
Major cities in the US and across the globe are awash with people staring at their phones, walking into objects--and sometimes traffic, and seeking access to highly restricted areas such as the White House and the Pentagon seeking to "capture" various characters in the game.
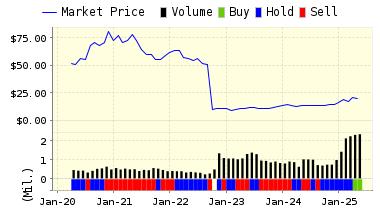
This interactive app has put the company back on the map in a big way. Since its release, the company's stock price has surged @40%. That's a big $9 billion shift in market cap for the firm--which is now valued at @ $30 billion.
However, is this newfound popularity going to really translate into bigger profits for the company? The app/game is free to download and play. However, it is what is known as a "freemium game" because players looking to boost their success may purchase items from Nintendo as they play.
The app was actually created by Niantic, a company spun off from Google/Alphabet. They use Nintendo characters in the game, but they are privately held, and thus it is unclear just which firm is going to make the money here. Nintendo doesn't really own "Pokemon" either, that is yet another Tokyo firm, but they have long made lots of revenues from that partnership.
Right now, analysts believe this may provide a big boost to Nintendo worthy of the surge in stock price, but as always, consumers, and the internets, are fickle. We will have to see if this Pokemon Go craze has staying power. We also need to see the true effects on the underlying partnerships and their revenue distribution deals to know if Nintendo has once again re-booted the Pokemon franchise.
Anecdotally, we can report that there are visible numbers of Pokemon Go players on the streets and that they include both younger children and adults old enough to have played Pokemon with cards "back in the day" when they themselves were children.
In the meantime, this quick stock run up will need to be digested by analysts and we shall see if earnings are going to get the kind of boost that will be noticed by our models.
ValuEngine continues its HOLD recommendation on NINTENDO LTD for 2016-07-11. Based on the information we have gathered and our resulting research, we feel that NINTENDO LTD has the probability to ROUGHLY MATCH average market performance for the next year. The company exhibits ATTRACTIVE Company Size but UNATTRACTIVE Price Sales Ratio.
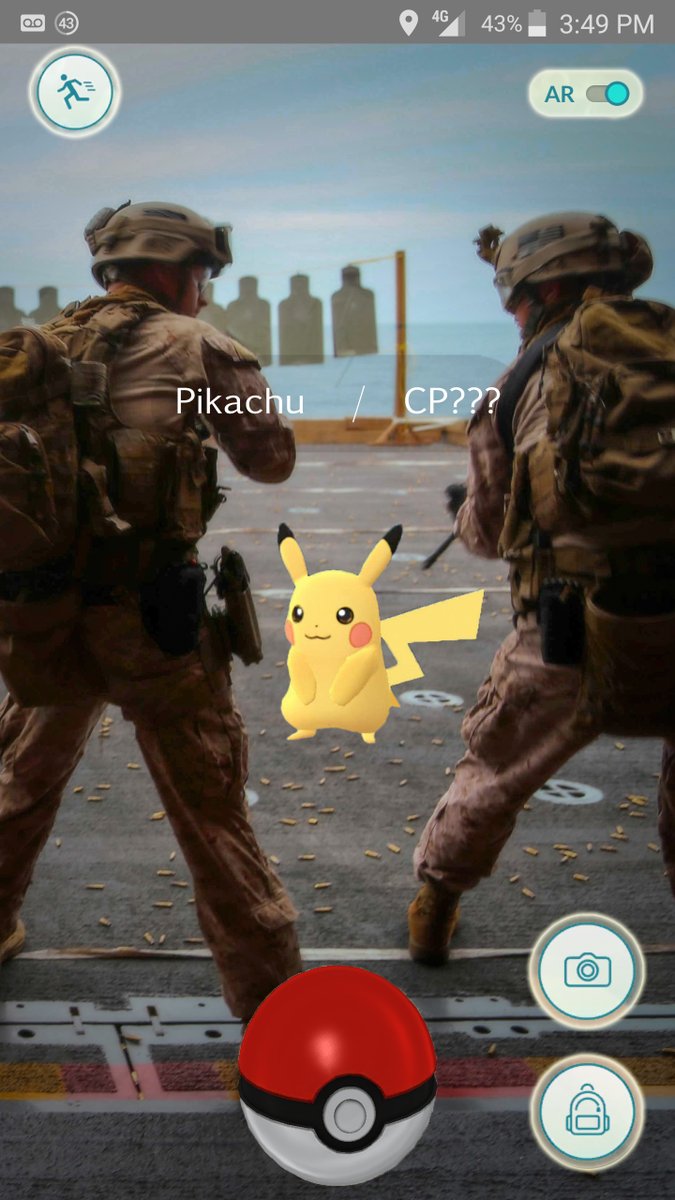
Pokemon Legend Pickachu Shows Up On A USMC Rifle Range
Photo Courtesy of
US Marines Twitter Account @USMC
You can download a free copy of detailed report on Nintendo from the link below.
ValuEngine Forecast |
| |
Target
Price* |
Expected
Return |
1-Month |
27.73 |
0.12% |
3-Month |
28.12 |
1.50% |
6-Month |
29.08 |
4.99% |
1-Year |
28.11 |
1.47% |
2-Year |
32.72 |
18.12% |
3-Year |
37.29 |
34.61% |
Valuation & Rankings |
Valuation |
41.17% overvalued |
|
 6 6 |
1-M Forecast Return |
0.12% |
1-M Forecast Return Rank |
60 |
12-M Return |
37.98% |
|
90 |
Sharpe Ratio |
-0.16 |
|
44 |
5-Y Avg Annual Return |
-5.41% |
5-Y Avg Annual Rtn Rank |
44 |
Volatility |
34.00% |
|
52 |
Expected EPS Growth |
250.00% |
|
95 |
Market Cap (billions) |
31.39 |
Size Rank |
97 |
Trailing P/E Ratio |
346.25 |
|
33 |
Forward P/E Ratio |
98.93 |
Forward P/E Ratio Rank |
4 |
PEG Ratio |
1.38 |
PEG Ratio Rank |
33 |
Price/Sales |
7.52 |
|
13 |
Market/Book |
3.29 |
|
35 |
Beta |
0.76 |
Beta Rank |
57 |
Alpha |
-0.18 |
Alpha Rank |
34 |

DOWNLOAD A FREE SAMPLE OF OUR NINTENDO (NTDOY) REPORT BY CLICKING HERE
ValuEngine Market Overview
Summary of VE Stock Universe |
Stocks Undervalued |
59.49% |
Stocks Overvalued |
40.51% |
Stocks Undervalued by 20% |
26.07% |
Stocks Overvalued by 20% |
13.57% |
ValuEngine Sector Overview
|
|
|
|
|
|
|
|
2.15% |
3.75% |
44.72% |
13.80% overvalued |
41.81% |
30.30 |
|
1.18% |
1.43% |
9.40% |
5.95% overvalued |
7.09% |
24.40 |
|
1.24% |
1.44% |
12.20% |
4.66% overvalued |
10.13% |
23.36 |
|
1.04% |
-0.15% |
3.97% |
1.30% overvalued |
-4.22% |
18.54 |
|
1.79% |
1.10% |
6.62% |
2.64% undervalued |
-3.02% |
21.89 |
|
1.54% |
-0.32% |
15.49% |
2.65% undervalued |
-24.50% |
23.86 |
|
1.64% |
1.27% |
12.34% |
4.00% undervalued |
-7.03% |
23.07 |
|
1.34% |
1.99% |
22.85% |
4.65% undervalued |
2.74% |
21.24 |
|
1.63% |
0.91% |
-3.81% |
4.93% undervalued |
-1.60% |
19.53 |
|
1.79% |
0.95% |
6.56% |
6.28% undervalued |
-3.24% |
29.14 |
|
1.32% |
0.54% |
2.03% |
6.59% undervalued |
-2.34% |
15.92 |
|
1.25% |
1.85% |
4.43% |
7.10% undervalued |
-6.55% |
21.40 |
|
1.79% |
1.93% |
-1.55% |
11.81% undervalued |
-12.19% |
21.70 |
|
1.71% |
3.23% |
-0.93% |
11.92% undervalued |
-20.35% |
27.37 |
|
2.22% |
1.93% |
3.10% |
12.92% undervalued |
-24.83% |
13.69 |
|
2.38% |
0.96% |
-4.43% |
20.72% undervalued |
-11.25% |
11.99 |
ValuEngine.com is an independent research provider, producing buy/hold/sell recommendations, target price, and valuations on over 7,000 US and Canadian equities every trading day.
Visit www.ValuEngine.com for more information

|


