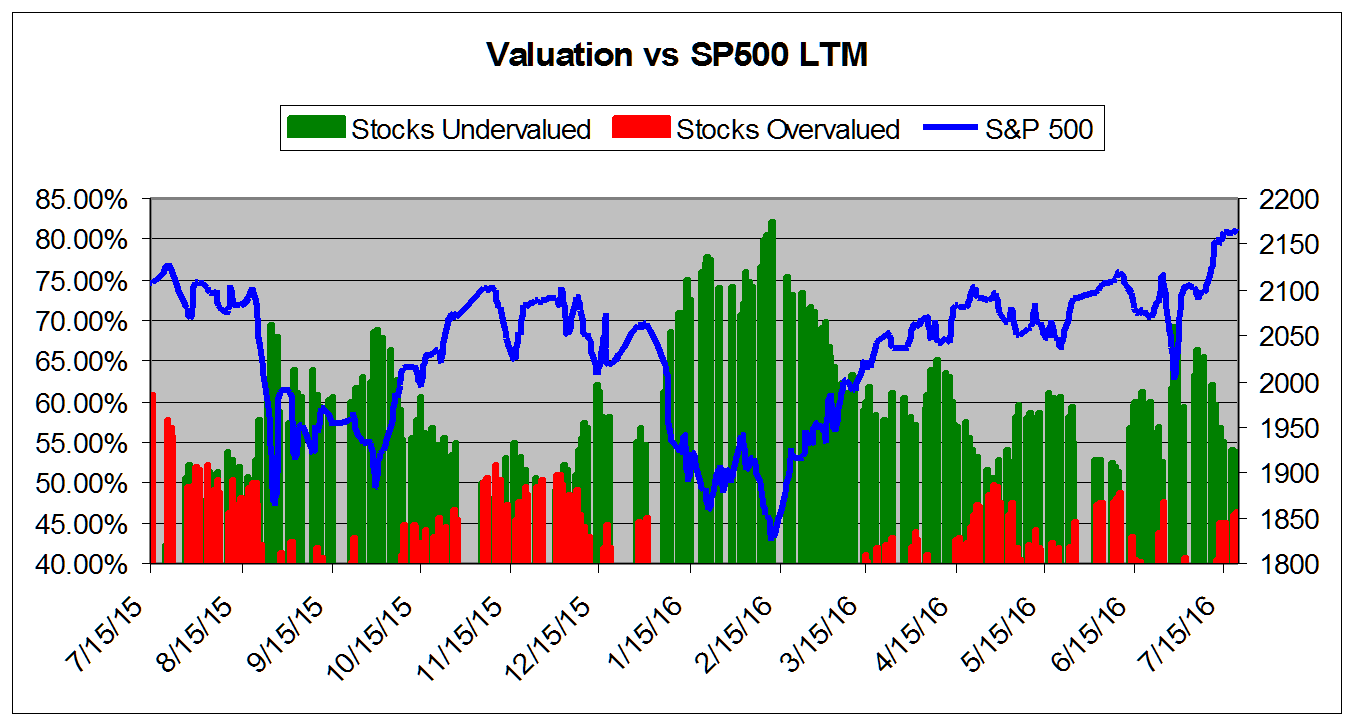
July 19, 2016VALUATION WATCH: Overvalued stocks now make up 46.27% of our stocks assigned a valuation and 15.47% of those equities are calculated to be overvalued by 20% or more. Seven sectors are calculated to be overvalued. If you cannot display this bulletin properly, GO HERE Looking UpValuations Back Up As Brexit Panic FadesValuEngine tracks more than 7000 US equities, ADRs, and foreign stock which trade on US exchanges as well as @1000 Canadian equities. When EPS estimates are available for a given equity, our model calculates a level of mispricing or valuation percentage for that equity based on earnings estimates and what the stock should be worth if the market were totally rational and efficient--an academic exercise to be sure, but one which allows for useful comparisons between equities, sectors, and industries. Using our Valuation Model, we can currently assign a VE valuation calculation to more than 2800 stocks in our US Universe. We combine all of the equities with a valuation calculation to track market valuation figures and use them as a metric for making calls about the overall state of the market. Two factors can lower these figures-- a market pullback, or a significant rise in EPS estimates. Vice-versa, a significant rally or reduction in EPS can raise the figure. Whenever we see overvaluation levels in excess of @ 65% for the overall universe and/or 27% for the overvalued by 20% or more categories, we issue a valuation warning. We now calculate that 46% of the stocks we can assign a valuation are overvalued and 15.47% of those stocks are overvalued by 20% or more. These numbers have increased-- slightly-- since we published our valuation study in June-- when the overvaluation was at 40%. That last study was published just a week before the Brexit vote. Think back to the panic we saw soon after moment, with the doomsayers screaming that investors should SELL SELL SELL! Yet another illustration of the point that selling in the midst of crisis is typically the worst possible response for the long-term investor. At this point, that blip looks like little more than "noise." So, those who sold in the midst of that Brexit-induced panic locked in their losses. For now, our valuation figures still show a "normal" market, with valuations nowhere near that bargain level they presented in the immediate aftermath of the Brexit vote. The chart below tracks the valuation metrics from July 2015. It shows levels in excess of 40%.
This chart shows overall universe over valuation in excess of 40% vs the S&P 500 from July 2013
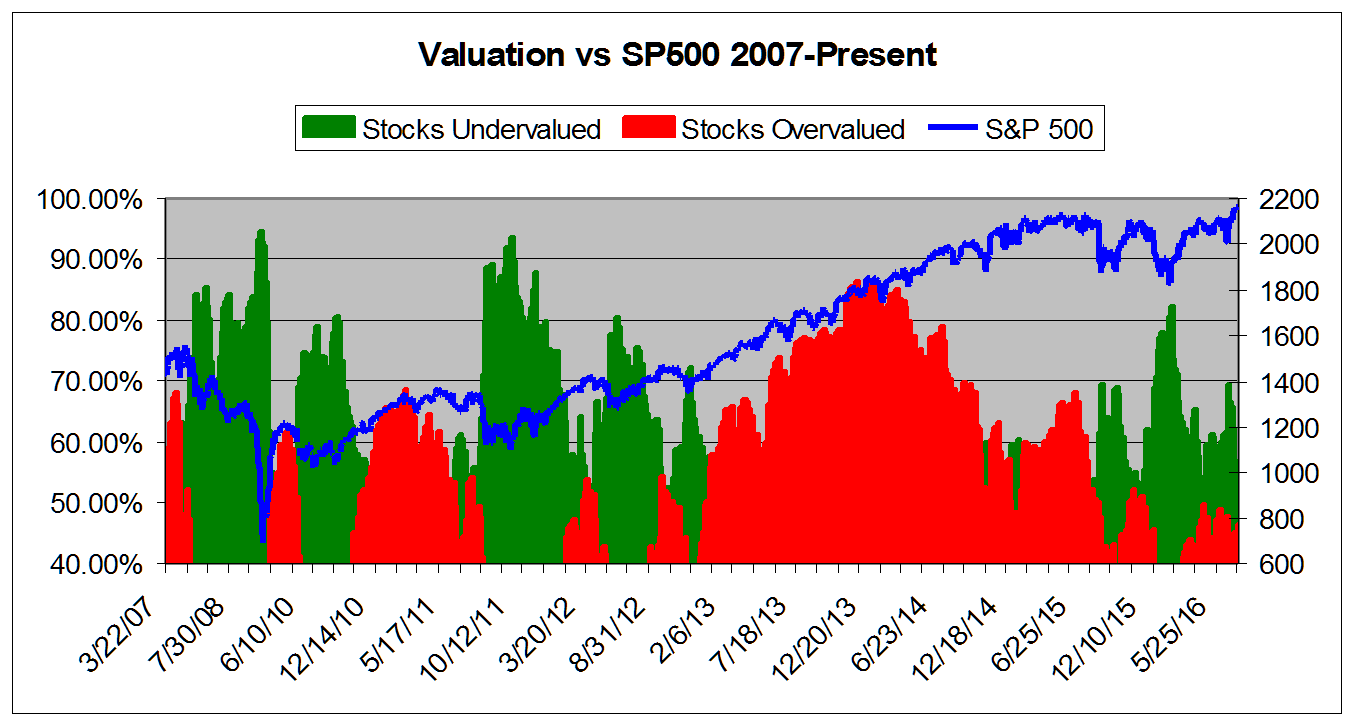
This chart shows overall universe under and over valuation in excess of 40% vs the S&P 500 from March 2007*
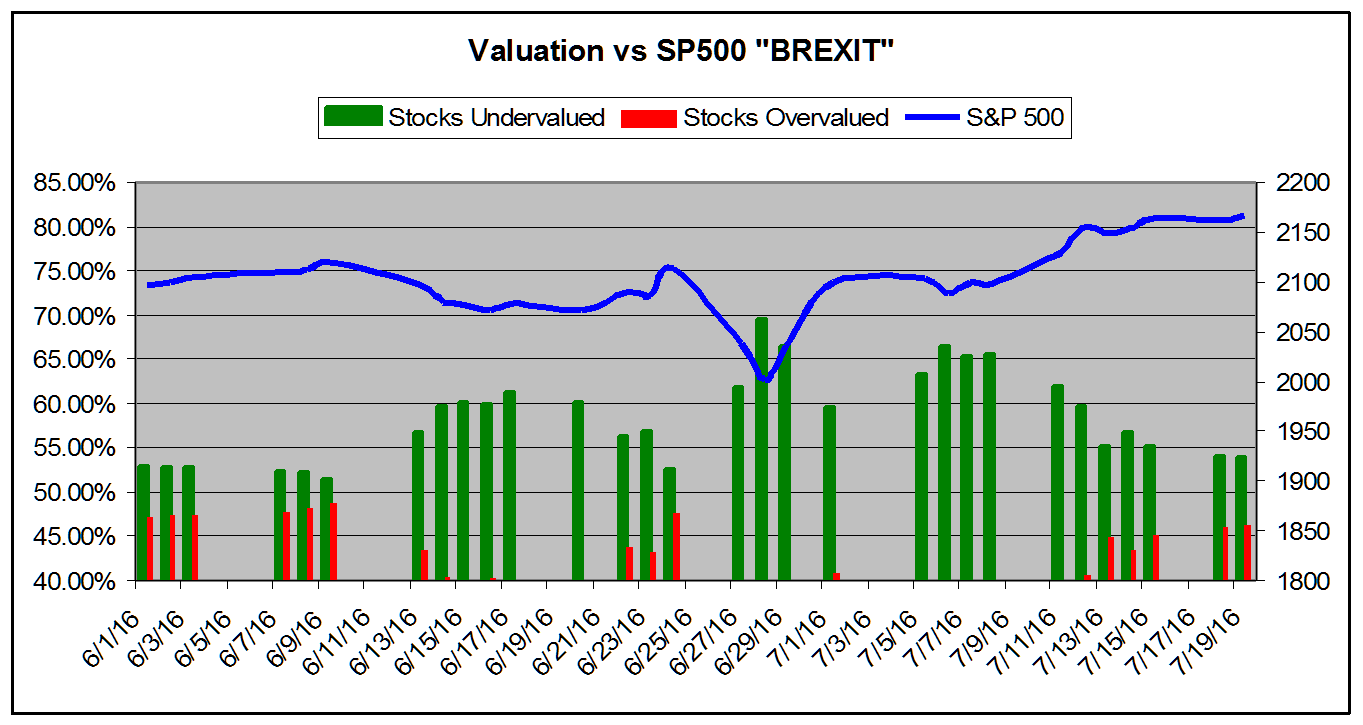
The chart below tracks the valuation metrics for June and July, 2016. It encompasses the Brexit sell off. It shows levels in excess of 40%.
ValuEngine Market Overview
ValuEngine Sector Overview
ValuEngine.com is an independent research provider, producing buy/hold/sell recommendations, target price, and valuations on over 7,000 US and Canadian equities every trading day.
Visit www.ValuEngine.com for more information
|
|||||||||||||||||||||||||||||||||||||||||||||||||||||||||||||||||||||||||||||||||||||||||||||||||||||||||||||||||||||||||||||||||||