July 21, 2016
VALUATION WATCH: Overvalued stocks now make up 47.03% of our stocks assigned a valuation and 15.38% of those equities are calculated to be overvalued by 20% or more. Seven sectors are calculated to be overvalued.
If you cannot display this bulletin properly, GO HERE
Material World Redux
--ValuEngine: Applied Materials Maintains NASDAQ Lead
ValuEngine tracks more than 7000 US equities, ADRs, and foreign stock which trade on US exchanges as well as @1000 Canadian equities. When EPS estimates are available for a given equity, our model calculates a level of mispricing or valuation percentage for that equity based on earnings estimates and what the stock should be worth if the market were totally rational and efficient--an academic exercise to be sure, but one which allows for useful comparisons between equities, sectors, and industries. Using our Valuation Model, we can currently assign a VE valuation calculation to more than 2800 stocks in our US Universe.
We also use trading data to provide forecast estimates for a variety of time horizons for almost ever equity in our database. Our Buy/Sell/Hold recommendations are based upon the 1-year forecast return figure. Using valuation and forecast figures, you can rank and rate our covered stocks against each other, to find out, in an objective and systematic way, the most attractive investment targets based on your own risk/reward parameters. We re-calculate the entire database every trading day, so you are assured that every proprietary valuation and forecast datapoint is as up-to-date as possible.
We can use our data to track individual stocks, industries, sectors, and indices. For today's bulletin, we present key metrics for the top picks in the NASDAQ 100. The companies listed below represent the top-ten BUY and STRONG BUY stocks within the index. They are presented below according to their one-month forecast target prices.
Since the end of June. we don't see much change in our top tem. Google and Amgen are gone, replaced by newcomers Activision and Texas Instruments. Applied Materials (AMAT) retains its number one spot for yet another month. Lam Research, Cisco Systems, and Citrix move up a few spots. Intel, Broadcom, and CA Inc have declines a few positions. Our top-ten is thus fairly solid for the past few months, with just a few changes at the margins. As is typically the case as well, our top-ten remains dominated by tech firms.
Ticker |
Company Name |
Market Price |
Valuation |
Last 12-M Retrn |
1-M Forecast Retn |
1-Yr Forecast Retn |
P/E Ratio |
Sector |
6-30-2016 Leaders |
AMAT |
APPLD MATLS INC |
26.65 |
-7.11% |
49.97% |
0.98% |
11.80% |
20.29 |
Computer and Technology |
AMAT |
LRCX |
LAM RESEARCH |
91.21 |
1.40% |
18.33% |
0.91% |
10.97% |
14.69 |
Computer and Technology |
INTC |
INTC |
INTEL CORP |
35.69 |
9.48% |
22.65% |
0.90% |
10.82% |
14.57 |
Computer and Technology |
AVGO |
NTES |
NETEASE INC |
199.05 |
4.45% |
32.55% |
0.77% |
9.20% |
19.51 |
Computer and Technology |
NTES |
AVGO |
BROADCOM LTD |
162.67 |
-0.57% |
20.82% |
0.75% |
9.03% |
18.30 |
Computer and Technology |
LRCX |
CSCO |
CISCO SYSTEMS |
30.63 |
2.29% |
9.28% |
0.67% |
8.08% |
14.52 |
Computer and Technology |
CA |
CTXS |
CITRIX SYS INC |
85.99 |
2.20% |
23.99% |
0.62% |
7.48% |
20.33 |
Computer and Technology |
CSCO |
CA |
CA INC |
34.27 |
20.39% |
12.40% |
0.53% |
6.33% |
15.37 |
Computer and Technology |
AMGN |
ATVI |
ACTIVISION BLZD |
41.38 |
15.71% |
57.64% |
0.53% |
6.31% |
26.70 |
Consumer Discretionary |
CTXS |
TXN |
TEXAS INSTRS |
65.45 |
11.26% |
30.66% |
0.49% |
5.82% |
23.05 |
Computer and Technology |
GOOG |
NOTE: New stocks are in BOLD, old stocks that have moved up the list are in GREEN, old stocks that have declined in position are in RED, and stocks which have retained their position are in CAPS.
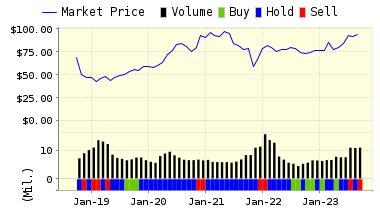
Below is today's data on Activision Blizzard (ATVI):
ACTIVISION BLIZZARD, INC. is a worldwide pure-play online and console game publisher with leading market positions across all categories of the rapidly growing interactive entertainment software industry. Activision Blizzard's portfolio includes best-selling video games such as Guitar Hero, Call of Duty, and Tony Hawk, as well as Spider-Man, X-Men, Shrek, James Bond and TRANSFORMERS, leading franchises such as Crash Bandicoot and Spyro and Blizzard Entertainment's StarCraft, Diablo, and Warcraft franchises including the global number one subscription-based massively multi-player online role-playing game, World of Warcraft. Activision Blizzard maintains operations in the U.S., Canada, the United Kingdom, France, Germany, Ireland, Italy, Sweden, Spain, Norway, Denmark, the Netherlands, Romania, Australia, Chile, India, Japan, China, the region of Taiwan and South Korea.
VALUENGINE RECOMMENDATION: ValuEngine continues its BUY recommendation on ACTIVISION BLZD for 2016-07-20. Based on the information we have gathered and our resulting research, we feel that ACTIVISION BLZD has the probability to OUTPERFORM average market performance for the next year. The company exhibits ATTRACTIVE Company Size and Sharpe Ratio.
You can download a free copy of detailed report on Activision Blizzard from the link below.
ValuEngine Forecast |
| |
Target
Price* |
Expected
Return |
1-Month |
41.60 |
0.53% |
3-Month |
42.20 |
1.98% |
6-Month |
43.33 |
4.71% |
1-Year |
43.99 |
6.31% |
2-Year |
46.76 |
13.00% |
3-Year |
50.86 |
22.92% |
Valuation & Rankings |
Valuation |
15.71% overvalued |
|
 20 20 |
1-M Forecast Return |
0.53% |
1-M Forecast Return Rank |
85 |
12-M Return |
57.64% |
|
94 |
Sharpe Ratio |
0.97 |
|
97 |
5-Y Avg Annual Return |
24.43% |
5-Y Avg Annual Rtn Rank |
95 |
Volatility |
25.28% |
|
66 |
Expected EPS Growth |
37.63% |
|
70 |
Market Cap (billions) |
29.75 |
Size Rank |
97 |
Trailing P/E Ratio |
26.70 |
|
48 |
Forward P/E Ratio |
19.40 |
Forward P/E Ratio Rank |
35 |
PEG Ratio |
0.71 |
PEG Ratio Rank |
51 |
Price/Sales |
6.15 |
|
16 |
Market/Book |
3.56 |
|
33 |
Beta |
0.94 |
Beta Rank |
48 |
Alpha |
0.48 |
Alpha Rank |
95 |

DOWNLOAD A FREE SAMPLE OF OUR APPLIED MATERIALS (AMAT) REPORT BY CLICKING HERE
ValuEngine Market Overview
Summary of VE Stock Universe |
Stocks Undervalued |
52.97% |
Stocks Overvalued |
47.03% |
Stocks Undervalued by 20% |
22.9% |
Stocks Overvalued by 20% |
15.38% |
ValuEngine Sector Overview
|
|
|
|
|
|
|
|
-1.06% |
6.03% |
45.12% |
13.23% overvalued |
48.65% |
31.54 |
|
-0.38% |
2.60% |
10.11% |
8.52% overvalued |
6.18% |
24.51 |
|
0.28% |
2.54% |
13.51% |
6.62% overvalued |
9.18% |
23.44 |
|
0.67% |
2.55% |
6.73% |
5.89% overvalued |
-4.99% |
18.77 |
|
0.77% |
5.22% |
10.91% |
2.13% overvalued |
-0.46% |
22.76 |
|
0.83% |
4.08% |
15.03% |
0.77% overvalued |
-4.83% |
23.74 |
|
0.94% |
6.14% |
27.55% |
0.04% overvalued |
3.06% |
22.34 |
|
0.29% |
2.64% |
-2.49% |
0.05% undervalued |
-4.76% |
19.18 |
|
0.38% |
1.01% |
15.49% |
0.55% undervalued |
-18.30% |
24.60 |
|
0.68% |
4.35% |
9.90% |
0.94% undervalued |
-2.37% |
30.01 |
|
0.23% |
3.39% |
4.66% |
1.71% undervalued |
-1.88% |
16.28 |
|
0.45% |
4.58% |
7.08% |
2.43% undervalued |
-7.72% |
21.87 |
|
0.60% |
3.32% |
-0.17% |
8.28% undervalued |
-9.22% |
22.24 |
|
0.46% |
6.44% |
7.26% |
8.32% undervalued |
-23.40% |
14.14 |
|
1.12% |
4.83% |
-0.04% |
9.59% undervalued |
-23.10% |
27.91 |
|
0.63% |
4.49% |
1.82% |
16.43% undervalued |
-10.49% |
12.54 |
ValuEngine.com is an independent research provider, producing buy/hold/sell recommendations, target price, and valuations on over 7,000 US and Canadian equities every trading day.
Visit www.ValuEngine.com for more information

|


