| August 3, 2016
 VALUATION WATCH: Overvalued stocks now make up 43.68% of our stocks assigned a valuation and 13.34% of those equities are calculated to be overvalued by 20% or more. Five sectors are calculated to be overvalued. If you cannot display this bulletin properly, GO HERE One To WatchWeight Watchers Is Top ValuEngine STRONG BUYValuEngine tracks       more than 7000 US equities, ADRs, and foreign stock   which trade on   US     exchanges as well as @1000 Canadian equities.  When EPS estimates are available for a   given   equity, our   model calculates a level of mispricing or valuation       percentage for   that equity based on earnings estimates and what the     stock should be   worth if   the market were totally rational and     efficient--an academic   exercise to   be sure, but one which allows for     useful comparisons   between equities,   sectors, and industries.   Using   our Valuation Model,   we can currently assign a VE valuation     calculation to more than 2800   stocks in our US Universe. We combine all of the       equities with a valuation calculation to track  market valuation   figures       and use them as a metric for making calls about the   overall state   of     the market.  Two   factors can lower these figures-- a market pullback, or a significant rise in EPS estimates. 
 We also use trading data to provide forecast estimates for a variety of time horizons for almost ever equity in our database. Our Buy/Sell/Hold recommendations are based upon the 1-year forecast return figure. Using valuation and forecast figures, you can rank and rate our covered stocks against each other, to find out, in an objective and systematic way, the most attractive investment targets based on your own risk/reward parameters. We re-calculate the entire database every trading day, so you are assured that every proprietary valuation and forecast datapoint is as up-to-date as possible.
 So, for today's bulletin we used our website's advanced screening functions to search for the top-rated STRONG BUY US stock with valuation data that meets minimum liquidity requirements. Weight Watchers International, Inc. (WTW) currently leads our universe. Weight Watchers International, Inc. is the largest provider of weight   control programs in the world. The core of their business is weekly   meetings, in which they present thier scientifically designed program,   incorporating group support and education about healthy eating patterns,   behavior modification and physical activity.  ValuEngine continues its STRONG BUY recommendation on WEIGHT WATCHERS for 2016-08-02.   	Based on the information we have gathered and our resulting research,   	we feel that WEIGHT WATCHERS has the probability to OUTPERFORM average market performance for the next year.   	The company exhibits  ATTRACTIVE Momentum and Price Sales Ratio. 
 You can download a free copy of detailed report on Weight Watchers from the link below.


                      | ValuEngine Forecast |  
                      |  | TargetPrice*
 | ExpectedReturn
 |  
                      | 1-Month | 10.86 | 1.59% |  
                      | 3-Month | 10.82 | 1.24% |  
                      | 6-Month | 10.71 | 0.17% |  
                      | 1-Year | 12.74 | 19.14% |  
                      | 2-Year | 8.51 | -20.36% |  
                      | 3-Year | 5.81 | -45.67% | 
                
                  
                    | Valuation & Rankings |  
                    | Valuation | 31.12% undervalued |  |  86 |  
                    | 1-M Forecast Return | 1.59% | 1-M Forecast Return Rank |  100 |  
                    | 12-M Return | 156.97% |  |  98 |  
                    | Sharpe                          Ratio | -0.46 |  |  23 |  
                    | 5-Y                          Avg Annual Return | -37.34% | 5-Y Avg Annual Rtn Rank |  18 |  
                    | Volatility | 81.74% |  |  19 |  
                    | Expected                          EPS Growth | 50.35% |  |  75 |  
                    | Market                          Cap (billions) | 0.61 | Size       Rank |  59 |  
                    | Trailing P/E                          Ratio | 15.06 |  |  76 |  
                    | Forward P/E Ratio | 10.01 | Forward P/E Ratio Rank |  82 |  
                    | PEG Ratio | 0.30 | PEG Ratio Rank |  69 |  
                    | Price/Sales | 0.53 |  |  81 |  
                    | Market/Book | n/a |  |  n/a |  
                    | Beta | 2.62 | Beta Rank |  6 |  
                    | Alpha | 1.01 | Alpha Rank |  98 |  
 
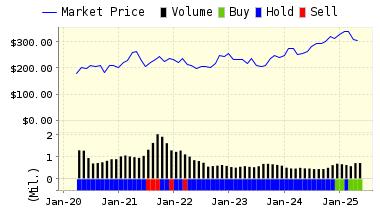
 DOWNLOAD A FREE SAMPLE  OF OUR WEIGHT WATCHERS (WTW) REPORT BY CLICKING HERE 
     ValuEngine Market Overview
                
                  | Summary of VE Stock Universe  |  
                  | Stocks Undervalued  | 56.32% |  
                  | Stocks Overvalued  | 43.68% |  
                  | Stocks Undervalued by 20%  | 23.57% |  
                  | Stocks Overvalued by 20%  | 13.34% |  ValuEngine Sector Overview
                
                  |  |  |  |  |  |  |  |  
                  |  | 2.77% | -0.60% | 51.29% | 12.85% overvalued | 61.16% | 32.88 |  
                  |  | 0.57% | -0.64% | 8.54% | 8.47% overvalued | 7.77% | 24.65 |  
                  |  | -1.04% | -2.16% | 11.40% | 5.52% overvalued | 12.51% | 22.64 |  
                  |  | 0.45% | -1.19% | 9.60% | 2.37% overvalued | 1.62% | 22.72 |  
                  |  | 1.17% | -0.37% | 6.66% | 1.13% overvalued | 5.73% | 18.52 |  
                  |  | -0.38% | -0.70% | -3.32% | 0.44% undervalued | -2.92% | 18.93 |  
                  |  | 1.14% | -0.95% | 27.87% | 1.87% undervalued | 7.06% | 20.96 |  
                  |  | 0.39% | -0.68% | 4.58% | 2.83% undervalued | -0.09% | 16.40 |  
                  |  | -0.32% | -1.07% | 10.39% | 2.85% undervalued | 1.35% | 29.36 |  
                  |  | 0.92% | -2.85% | 16.69% | 2.97% undervalued | -13.95% | 27.43 |  
                  |  | 0.03% | -0.77% | 6.57% | 3.12% undervalued | -4.70% | 22.41 |  
                  |  | -0.58% | -1.54% | 8.33% | 5.38% undervalued | -20.46% | 16.12 |  
                  |  | 0.06% | -1.46% | 12.81% | 6.42% undervalued | -1.07% | 23.73 |  
                  |  | -0.74% | -1.07% | 0.11% | 8.35% undervalued | -19.94% | 27.27 |  
                  |  | 0.45% | -1.22% | -0.30% | 10.37% undervalued | -6.64% | 22.17 |  
                  |  | -1.04% | -1.85% | 0.29% | 12.08% undervalued | -4.35% | 14.62 |    ValuEngine.com is an independent research provider, producing   buy/hold/sell recommendations, target price, and valuations on over   7,000 US and Canadian equities every trading day. Visit www.ValuEngine.com for more information
  
 |