August 4, 2016
VALUATION WATCH: Overvalued stocks now make up 45.05% of our stocks assigned a valuation and 13.89% of those equities are calculated to be overvalued by 20% or more. Six sectors are calculated to be overvalued.
If you cannot display this bulletin properly, GO HERE
High Fashion
--Michael Kors Takes Retains Lead Despite Turnover on ValuEngine Top SP500 Stock List
ValuEngine tracks more than 7000 US equities, ADRs, and foreign stock which trade on US exchanges as well as @1000 Canadian equities. When EPS estimates are available for a given equity, our model calculates a level of mispricing or valuation percentage for that equity based on earnings estimates and what the stock should be worth if the market were totally rational and efficient--an academic exercise to be sure, but one which allows for useful comparisons between equities, sectors, and industries. Using our Valuation Model, we can currently assign a VE valuation calculation to more than 2800 stocks in our US Universe.
We also use trading data to provide forecast estimates for a variety of time horizons for almost ever equity in our database. Our Buy/Sell/Hold recommendations are based upon the 1-year forecast return figure. Using valuation and forecast figures, you can rank and rate our covered stocks against each other, to find out, in an objective and systematic way, the most attractive investment targets based on your own risk/reward parameters. We re-calculate the entire database every trading day, so you are assured that every proprietary valuation and forecast datapoint is as up-to-date as possible.
We can use our data to track individual stocks, industries, sectors, and indices. For today's bulletin, we present key metrics for the top picks in the S&P 500. The companies listed below represent the top-ten BUY/STRONG BUY stocks within the index. They are presented below according to their one-month forecast target prices.
In our last update, Michael Kors (KORS) took over the number one spot and the company remains in the lead this week. However, in a bit of a shift, we see a lot of turnover this time around. We have six new members of our top-ten list in First Solar, Global Payments, United Rentals, Hormel Foods, Century Link, and Edwards Lifesciences. Two of the remaining stocks from last time, Applied Materials and KLA-Tencor, have improved their positions while the last hold out, Tyson Foods, has declined from third spot to ninth. Southwest Airlines, long-time member (and leader) Traveler's, Verizon, DR Horton, Chubb LTD, and AFLAC have left our top-ten list.
Ticker |
Company Name |
Market Price |
Valuation |
Last 12-M Retrn |
1-M Forecast Retn |
1-Yr Forecast Retn |
P/E Ratio |
Sector Name |
July 14, 2016 |
KORS |
MICHAEL KORS |
49.02 |
-33.86% |
26.63% |
1.41% |
17.02% |
11.30 |
Consumer Discretionary |
KORS |
FSLR |
FIRST SOLAR INC |
49.24 |
-8.93% |
12.70% |
1.06% |
12.77% |
7.69 |
Oils-Energy |
LUV |
GPN |
GLOBAL PAYMENTS |
73.16 |
-43.40% |
30.33% |
1.01% |
12.07% |
24.44 |
Business Services |
TSN |
URI |
UTD RENTALS INC |
76.6 |
-1.72% |
17.34% |
1.00% |
12.01% |
9.35 |
Construction |
TRV |
AMAT |
APPLD MATLS INC |
26.2 |
-3.94% |
52.68% |
0.97% |
11.69% |
19.26 |
Computer and Technology |
CB |
KLAC |
KLA-TENCOR CORP |
76.09 |
5.40% |
44.82% |
0.92% |
11.06% |
15.91 |
Computer and Technology |
AFL |
HRL |
HORMEL FOODS CP |
36.13 |
-41.34% |
21.59% |
0.89% |
10.63% |
23.31 |
Consumer Staples |
VZ |
CTL |
CENTURYLINK INC |
30.51 |
-20.20% |
5.57% |
0.89% |
10.61% |
11.01 |
Computer and Technology |
AMAT |
TSN |
TYSON FOODS A |
72.97 |
10.29% |
82.61% |
0.87% |
10.39% |
17.40 |
Consumer Staples |
DHI |
EW |
EDWARDS LIFESCI |
113.36 |
-22.11% |
50.06% |
0.86% |
10.28% |
42.25 |
Medical |
KLAC |
NOTE: New stocks are in BOLD, old stocks that have moved up the list are in GREEN, old stocks that have declined in position are in RED, and stocks which have retained their position are in CAPS.
Below is today's data on one of our SP500 top-ten newcomers, Global Payments (GPN)
Global Payments Inc. is a leading provider of electronic transaction processing services for consumers, merchants, Independent Sales Organizations, financial institutions, government agencies and multi- national corporations located throughout the United States, Canada, Latin America and Europe. Global Payments offers a comprehensive line of processing solutions for credit and debit cards, business-to-business purchasing cards, gift cards, electronic check conversion and check guarantee, verification and recovery, as well as terminal management. The company also provides consumer money transfer services from the U.S. and Europe to destinations in Latin America, Morocco, and the Philippines.
ValuEngine continues its BUY recommendation on GLOBAL PAYMENTS for 2016-08-03. Based on the information we have gathered and our resulting research, we feel that GLOBAL PAYMENTS has the probability to OUTPERFORM average market performance for the next year. The company exhibits ATTRACTIVE Sharpe Ratio and Momentum.
You can download a free copy of detailed report on KORS from the link below.
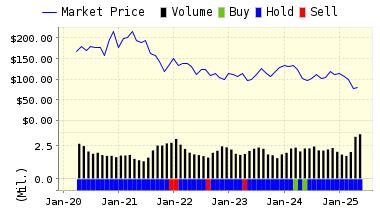
ValuEngine Forecast |
| |
Target
Price* |
Expected
Return |
1-Month |
73.90 |
1.01% |
3-Month |
72.87 |
-0.40% |
6-Month |
70.73 |
-3.33% |
1-Year |
81.99 |
12.07% |
2-Year |
50.25 |
-31.31% |
3-Year |
34.01 |
-53.51% |
Valuation & Rankings |
Valuation |
13.20% overvalued |
|
 92 92 |
1-M Forecast Return |
1.01% |
1-M Forecast Return Rank |
98 |
12-M Return |
30.33% |
|
86 |
Sharpe Ratio |
1.03 |
|
96 |
5-Y Avg Annual Return |
22.95% |
5-Y Avg Annual Rtn Rank |
94 |
Volatility |
22.18% |
|
71 |
Expected EPS Growth |
15.14% |
|
51 |
Market Cap (billions) |
4.95 |
Size Rank |
84 |
Trailing P/E Ratio |
24.44 |
|
51 |
Forward P/E Ratio |
21.23 |
Forward P/E Ratio Rank |
28 |
PEG Ratio |
1.61 |
PEG Ratio Rank |
29 |
Price/Sales |
1.73 |
|
50 |
Market/Book |
5.19 |
|
24 |
Beta |
1.12 |
Beta Rank |
39 |
Alpha |
0.25 |
Alpha Rank |
87 |

DOWNLOAD A FREE SAMPLE OF OUR GLOBAL PAYMENTS (GPN) REPORT BY CLICKING HERE
ValuEngine Market Overview
Summary of VE Stock Universe |
Stocks Undervalued |
54.95% |
Stocks Overvalued |
45.05% |
Stocks Undervalued by 20% |
22.89% |
Stocks Overvalued by 20% |
13.89% |
ValuEngine Sector Overview
|
|
|
|
|
|
|
|
0.70% |
-0.25% |
52.42% |
13.26% overvalued |
61.97% |
32.87 |
|
-0.36% |
-0.95% |
8.15% |
8.11% overvalued |
7.24% |
24.51 |
|
0.30% |
-1.83% |
11.87% |
5.24% overvalued |
12.10% |
22.55 |
|
0.70% |
-0.40% |
10.45% |
2.82% overvalued |
2.13% |
22.74 |
|
0.05% |
-0.29% |
6.88% |
1.66% overvalued |
6.09% |
18.59 |
|
0.02% |
-0.62% |
-3.11% |
0.69% overvalued |
-3.16% |
19.05 |
|
0.40% |
-0.44% |
28.84% |
1.04% undervalued |
7.74% |
21.10 |
|
2.49% |
0.47% |
22.83% |
1.39% undervalued |
-12.28% |
26.46 |
|
0.55% |
-0.10% |
5.10% |
2.14% undervalued |
0.31% |
16.46 |
|
0.42% |
-0.37% |
6.91% |
2.31% undervalued |
-4.24% |
22.18 |
|
0.03% |
-0.83% |
10.74% |
2.36% undervalued |
1.80% |
29.20 |
|
0.15% |
-1.13% |
10.16% |
4.80% undervalued |
-20.57% |
16.23 |
|
0.34% |
-1.03% |
13.18% |
6.77% undervalued |
-1.30% |
23.81 |
|
0.90% |
-0.07% |
0.97% |
7.71% undervalued |
-19.06% |
27.31 |
|
0.47% |
-0.72% |
0.05% |
9.85% undervalued |
-4.71% |
22.35 |
|
0.84% |
-0.98% |
4.16% |
10.93% undervalued |
-3.50% |
14.64 |
ValuEngine.com is an independent research provider, producing buy/hold/sell recommendations, target price, and valuations on over 7,000 US and Canadian equities every trading day.
Visit www.ValuEngine.com for more information

|


