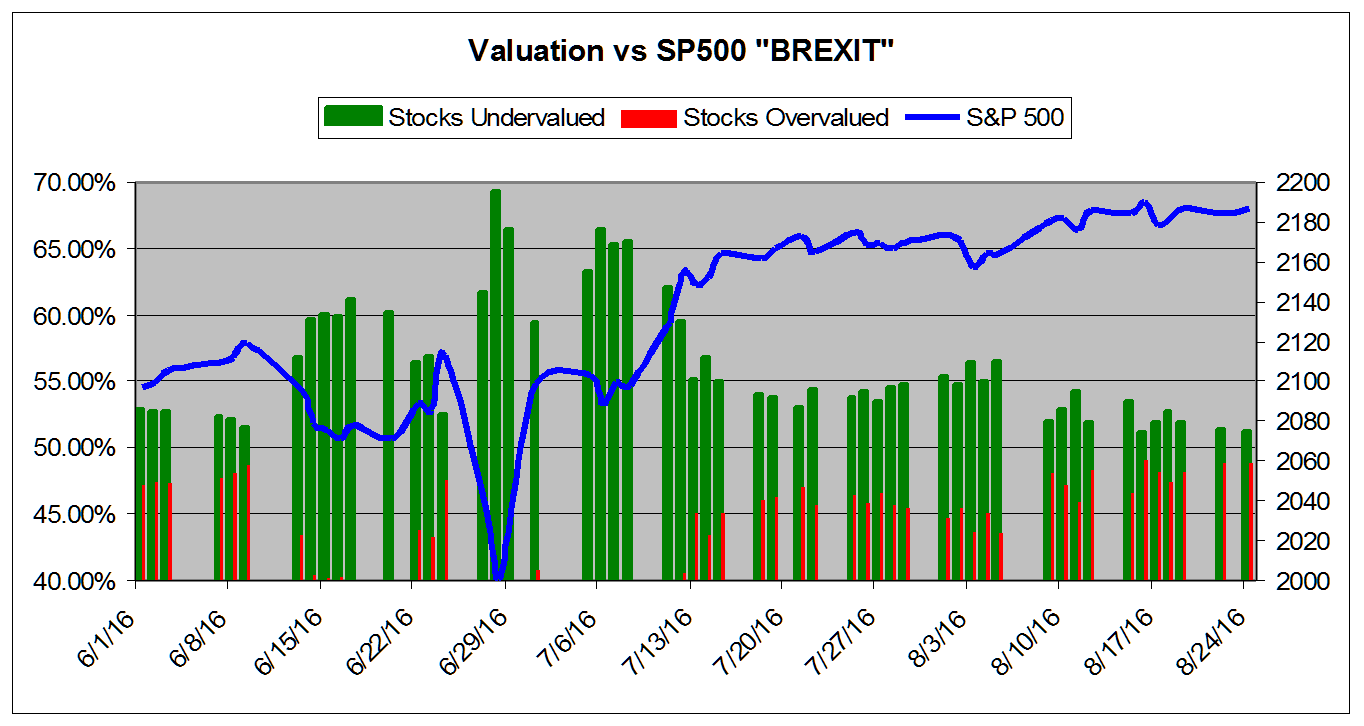
August 24, 2016VALUATION WATCH: Overvalued stocks now make up 48.83% of our stocks assigned a valuation and 16.16% of those equities are calculated to be overvalued by 20% or more. Nine sectors are calculated to be overvalued. If you cannot display this bulletin properly, GO HERE Melting in SummerValuations Remain In "Normal" RangeValuEngine tracks more than 7000 US equities, ADRs, and foreign stock which trade on US exchanges as well as @1000 Canadian equities. When EPS estimates are available for a given equity, our model calculates a level of mispricing or valuation percentage for that equity based on earnings estimates and what the stock should be worth if the market were totally rational and efficient--an academic exercise to be sure, but one which allows for useful comparisons between equities, sectors, and industries. Using our Valuation Model, we can currently assign a VE valuation calculation to more than 2800 stocks in our US Universe. We combine all of the equities with a valuation calculation to track market valuation figures and use them as a metric for making calls about the overall state of the market. Two factors can lower these figures-- a market pullback, or a significant rise in EPS estimates. Vice-versa, a significant rally or reduction in EPS can raise the figure. Whenever we see overvaluation levels in excess of @ 65% for the overall universe and/or 27% for the overvalued by 20% or more categories, we issue a valuation warning. We now calculate that 48.83% of the stocks we can assign a valuation are overvalued and 16.16% of those stocks are overvalued by 20% or more. These numbers have increased-- slightly-- since we published our valuation study in July-- when the overvaluation was at 46%. The markets in the US and elsewhere certainly shook off that Brexit panic, with several indices setting new records throughout this Summer. The word now is "melt up" with many of the more bullish analysts arguing that as investors return from their Summer vacations and buckle down again in Fall, we may find more money coming into the market. Currently, futures contracts indicate that most investors remain doubtful that the US central bank will raise rates in September or November. And, for the last chance in December investor think the odds are still @50-50. For now, our valuation figures still show a "normal" market, with valuations that remain nowhere near the bargain level they indicated in the immediate aftermath of the Brexit vote in June. The chart below tracks the valuation metrics so far this Summer. It encompasses the Brexit sell off. It shows levels in excess of 40%.
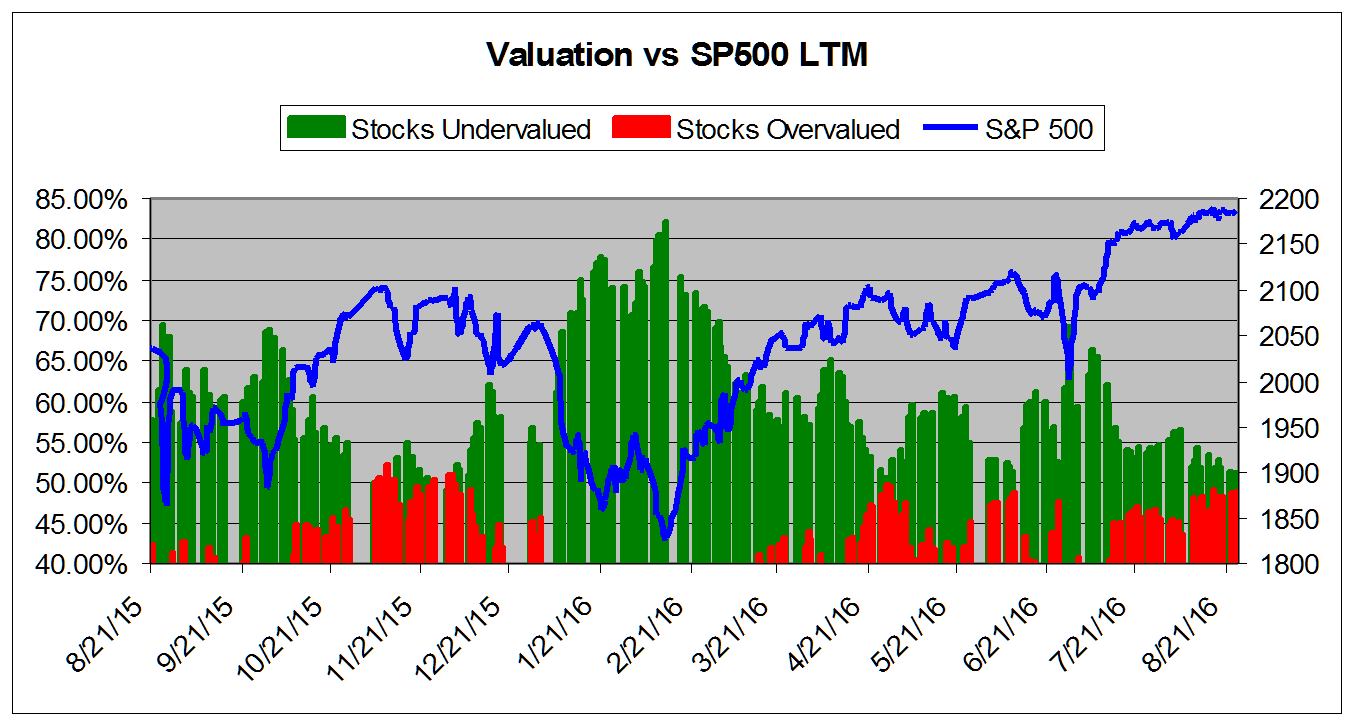
The chart below tracks the valuation metrics from August 2015. It shows levels in excess of 40%.
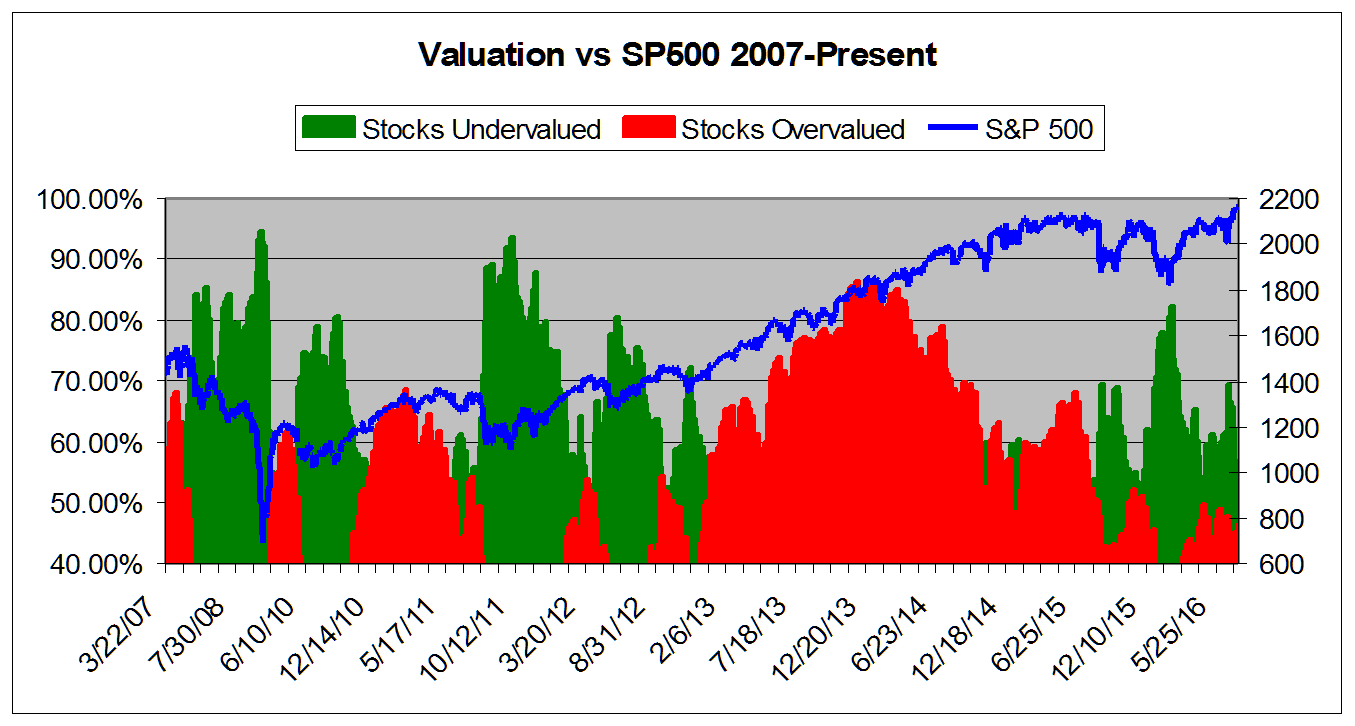
This chart shows overall universe over valuation in excess of 40% vs the S&P 500 from August 2013
This chart shows overall universe under and over valuation in excess of 40% vs the S&P 500 from March 2007*
ValuEngine Market Overview
ValuEngine Sector Overview
ValuEngine.com is an independent research provider, producing buy/hold/sell recommendations, target price, and valuations on over 7,000 US and Canadian equities every trading day.
Visit www.ValuEngine.com for more information
|
|||||||||||||||||||||||||||||||||||||||||||||||||||||||||||||||||||||||||||||||||||||||||||||||||||||||||||||||||||||||||||||||||||