September 7, 2016
VALUATION WATCH: Overvalued stocks now make up 48.88% of our stocks assigned a valuation and 15.39% of those equities are calculated to be overvalued by 20% or more. Nine sectors are calculated to be overvalued.
If you cannot display this bulletin properly, GO HERE
Wax On, Wax Off
Brazilian PetroChemical Giant Braskem Is Leading ValuEngine STRONG BUY
We use trading data to provide forecast estimates for a variety of time horizons for almost ever equity in our database. Our Buy/Sell/Hold recommendations are based upon the 1-year forecast return figure. Using valuation and forecast figures, you can rank and rate our covered stocks against each other, to find out, in an objective and systematic way, the most attractive investment targets based on your own risk/reward parameters. We re-calculate the entire database every trading day, so you are assured that every proprietary valuation and forecast datapoint is as up-to-date as possible.
For today's bulletin we used our website's advanced-screening functions to search for the top-rated STRONG BUY US stock with valuation data that meets minimum liquidity requirements. Our leader is the same as in mid-August--FivePrime Therapeutics. Since we provided data and a free stock report on that company already, this week we will focus on another top-ranked 5-Engine STRONG BUY, Braskem SA (BAK).
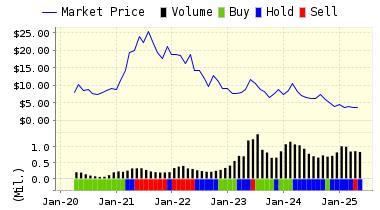
Braskem SA (BAK) figures as the largest petrochemical operation in Latin America and among the five largest private companies in Brazil. With industrial facilities located in Alagoas, Bahia, S�o Paulo and Rio Grande do Sul, Braskem produces primary base petrochemicals such as ethylene, propylene, benzene, caprolactam, DMT and termoplastic resins (polypropylene, polyethylene, PVC and PET) gas and GLP.
ValuEngine continues its STRONG BUY recommendation on BRASKEM SA for 2016-09-06. Based on the information we have gathered and our resulting research, we feel that BRASKEM SA has the probability to OUTPERFORM average market performance for the next year. The company exhibits ATTRACTIVE P/E Ratio and Momentum.
You can download a free copy of detailed report on Braskem SA (BAK) from the link below.
ValuEngine Forecast |
| |
Target
Price* |
Expected
Return |
1-Month |
15.25 |
1.61% |
3-Month |
15.59 |
3.88% |
6-Month |
15.85 |
5.63% |
1-Year |
17.94 |
19.51% |
2-Year |
15.89 |
5.89% |
3-Year |
15.05 |
0.25% |
Valuation & Rankings |
Valuation |
2.62% undervalued |
|
 55 55 |
1-M Forecast Return |
1.61% |
1-M Forecast Return Rank |
100 |
12-M Return |
87.16% |
|
94 |
Sharpe Ratio |
-0.19 |
|
36 |
5-Y Avg Annual Return |
-9.47% |
5-Y Avg Annual Rtn Rank |
35 |
Volatility |
49.34% |
|
37 |
Expected EPS Growth |
-63.77% |
|
5 |
Market Cap (billions) |
5.98 |
Size Rank |
86 |
Trailing P/E Ratio |
5.28 |
|
98 |
Forward P/E Ratio |
14.57 |
Forward P/E Ratio Rank |
60 |
PEG Ratio |
n/a |
PEG Ratio Rank |
n/a |
Price/Sales |
0.44 |
|
85 |
Market/Book |
10.28 |
|
13 |
Beta |
2.10 |
Beta Rank |
10 |
Alpha |
0.45 |
Alpha Rank |
93 |

DOWNLOAD A FREE SAMPLE OF OUR BRASKEM SA (BAK) REPORT BY CLICKING HERE
ValuEngine Market Overview
Summary of VE Stock Universe |
Stocks Undervalued |
51.12% |
Stocks Overvalued |
48.88% |
Stocks Undervalued by 20% |
21.31% |
Stocks Overvalued by 20% |
15.39% |
ValuEngine Sector Overview
|
|
|
|
|
|
|
|
0.40% |
0.98% |
9.55% |
18.40% overvalued |
8.87% |
20.79 |
|
1.72% |
4.22% |
52.33% |
5.07% overvalued |
65.37% |
32.30 |
|
0.30% |
1.26% |
17.76% |
4.97% overvalued |
11.64% |
23.20 |
|
0.23% |
1.41% |
12.46% |
4.96% overvalued |
16.67% |
24.18 |
|
1.03% |
2.52% |
17.86% |
4.91% overvalued |
-5.93% |
25.13 |
|
0.18% |
1.33% |
16.66% |
3.92% overvalued |
10.42% |
29.88 |
|
0.61% |
1.91% |
12.62% |
2.29% overvalued |
19.93% |
22.05 |
|
1.25% |
3.23% |
2.29% |
2.10% overvalued |
4.32% |
18.64 |
|
0.01% |
0.78% |
8.15% |
0.75% overvalued |
8.57% |
16.44 |
|
0.17% |
0.75% |
12.25% |
0.02% undervalued |
-13.90% |
15.54 |
|
-0.19% |
0.57% |
11.36% |
0.56% undervalued |
2.20% |
25.00 |
|
0.11% |
1.06% |
9.60% |
1.50% undervalued |
4.86% |
24.34 |
|
0.15% |
1.06% |
30.45% |
2.09% undervalued |
12.97% |
20.50 |
|
0.87% |
2.45% |
6.87% |
6.31% undervalued |
7.60% |
13.77 |
|
-0.40% |
0.30% |
2.28% |
8.75% undervalued |
-2.51% |
22.67 |
|
0.38% |
1.16% |
1.60% |
9.20% undervalued |
-12.67% |
28.34 |
ValuEngine.com is an independent research provider, producing buy/hold/sell recommendations, target price, and valuations on over 7,000 US and Canadian equities every trading day.
Visit www.ValuEngine.com for more information

|


