September 9, 2016
VALUATION WATCH: Overvalued stocks now make up 49.16% of our stocks assigned a valuation and 15.96% of those equities are calculated to be overvalued by 20% or more. Nine sectors are calculated to be overvalued.
If you cannot display this bulletin properly, GO HERE
Indexing
--ValuEngine: Verizon Still Number One DOW Stock
ValuEngine tracks more than 7000 US equities, ADRs, and foreign stock which trade on US exchanges as well as @1000 Canadian equities. When EPS estimates are available for a given equity, our model calculates a level of mispricing or valuation percentage for that equity based on earnings estimates and what the stock should be worth if the market were totally rational and efficient--an academic exercise to be sure, but one which allows for useful comparisons between equities, sectors, and industries. Using our Valuation Model, we can currently assign a VE valuation calculation to more than 2800 stocks in our US Universe.
We also use trading data to provide forecast estimates for a variety of time horizons for almost ever equity in our database. Our Buy/Sell/Hold recommendations are based upon the 1-year forecast return figure. Using valuation and forecast figures, you can rank and rate our covered stocks against each other, to find out, in an objective and systematic way, the most attractive investment targets based on your own risk/reward parameters. We re-calculate the entire database every trading day, so you are assured that every proprietary valuation and forecast datapoint is as up-to-date as possible.
We can use our data to track individual stocks, industries, sectors, and indices. For today's bulletin, we present key metrics for the top picks in the Dow Jones Industrials. The companies listed below represent the top stocks within the index. They are presented below according to their one-month forecast gain.
We once again see very little turnover here. In fact, we have just one new stock on our list since we presented the top Dow picks back in August. Merck just ekes into the top-ten list, replacing Home Depot. Verizon continues its run at the top this time around. The other mover and shaker is Cisco, which has vaulted all the way up from ninth spot to second. Also moving up is United Technologies. Declines were also made by Intel,
Traveler's Insurance, Johnson and Johnson, United Health, IBM, and DuPont. Also, be advised that none of these stocks are currently rated higher than BUY--there are no STRONG BUY picks in this edition of our DOW top-ten, and DD and MRK are rated HOLD.
Ticker |
Company Name |
Market Price |
Valuation |
Last 12-M Retrn |
1-M Forecast Retn |
1-Yr Forecast Retn |
P/E Ratio |
Sector Name |
Aug. 18,, 2016 |
VZ |
VERIZON COMM |
53.71 |
-0.73% |
17.07% |
0.71% |
8.56% |
13.76 |
Utilities |
VZ |
CSCO |
CISCO SYSTEMS |
31.79 |
2.07% |
20.87% |
0.69% |
8.23% |
14.79 |
Computer and Technology |
INTC |
INTC |
INTEL CORP |
36.46 |
6.72% |
23.59% |
0.67% |
8.01% |
14.45 |
Computer and Technology |
TRV |
TRV |
TRAVELERS COS |
118.68 |
8.35% |
19.10% |
0.66% |
7.91% |
12.01 |
Finance |
JNJ |
JNJ |
JOHNSON & JOHNS |
119.61 |
-0.65% |
27.33% |
0.66% |
7.87% |
18.56 |
Medical |
UNH |
UTX |
UTD TECHS CORP |
105.85 |
-2.86% |
14.04% |
0.47% |
5.65% |
16.31 |
Multi-Sector Conglomerates |
IBM |
UNH |
UNITEDHEALTH GP |
134.99 |
-5.16% |
16.28% |
0.42% |
5.07% |
19.01 |
Medical |
UTX |
IBM |
INTL BUS MACH |
161.64 |
2.34% |
9.79% |
0.42% |
4.99% |
12.07 |
Computer and Technology |
DD |
DD |
DU PONT (EI) DE |
69.41 |
11.10% |
39.91% |
0.39% |
4.67% |
23.56 |
Basic Materials |
CSCO |
MRK |
MERCK & CO INC |
62.87 |
12.86% |
19.32% |
0.33% |
3.90% |
16.89 |
Medical |
HD |
NOTE: New stocks are in BOLD, old stocks that have moved up the list are in GREEN, old stocks that have declined in position are in RED, and stocks which have retained their position are in CAPS.
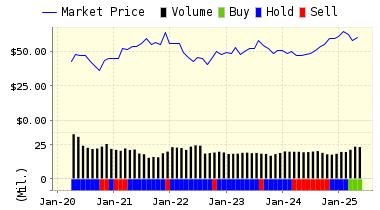
Below is today's data on Cisco Systems (CSCO):
Cisco Systems, Inc. is the worldwide leader in networking for the Internet. Cisco's Internet Protocol-based networking solutions are the foundation of the Internet and most corporate, education, and government networks around the world. Cisco provides the broadest line of solutions for transporting data, voice and video within buildings, across campuses, or around the world.
VALUENGINE RECOMMENDATION: ValuEngine continues its BUY recommendation on CISCO SYSTEMS for 2016-09-07. Based on the information we have gathered and our resulting research, we feel that CISCO SYSTEMS has the probability to OUTPERFORM average market performance for the next year. The company exhibits ATTRACTIVE Company Size and Sharpe Ratio.
You can download a free copy of detailed report on Cisco Systems (CSCO) from the link below.
ValuEngine Forecast |
| |
Target
Price* |
Expected
Return |
1-Month |
32.09 |
0.69% |
3-Month |
32.57 |
2.21% |
6-Month |
33.04 |
3.67% |
1-Year |
34.49 |
8.23% |
2-Year |
34.50 |
8.25% |
3-Year |
35.35 |
10.92% |
Valuation & Rankings |
Valuation |
2.33% overvalued |
|
 45 45 |
1-M Forecast Return |
0.69% |
1-M Forecast Return Rank |
92 |
12-M Return |
20.87% |
|
74 |
Sharpe Ratio |
0.56 |
|
82 |
5-Y Avg Annual Return |
13.93% |
5-Y Avg Annual Rtn Rank |
83 |
Volatility |
24.77% |
|
66 |
Expected EPS Growth |
4.03% |
|
29 |
Market Cap (billions) |
162.56 |
Size Rank |
100 |
Trailing P/E Ratio |
14.79 |
|
78 |
Forward P/E Ratio |
14.21 |
Forward P/E Ratio Rank |
62 |
PEG Ratio |
3.67 |
PEG Ratio Rank |
12 |
Price/Sales |
3.30 |
|
31 |
Market/Book |
4.72 |
|
27 |
Beta |
1.38 |
Beta Rank |
26 |
Alpha |
0.06 |
Alpha Rank |
71 |

DOWNLOAD A FREE SAMPLE OF OUR REPORT ON CISCO SYSTEMS (CSCO) BY CLICKING HERE
ValuEngine Market Overview
Summary of VE Stock Universe |
Stocks Undervalued |
50.84% |
Stocks Overvalued |
49.16% |
Stocks Undervalued by 20% |
21.05% |
Stocks Overvalued by 20% |
15.96% |
ValuEngine Sector Overview
|
|
|
|
|
|
|
|
0.40% |
0.98% |
9.55% |
18.40% overvalued |
8.87% |
20.79 |
|
1.72% |
4.22% |
52.33% |
5.07% overvalued |
65.37% |
32.30 |
|
0.30% |
1.26% |
17.76% |
4.97% overvalued |
11.64% |
23.20 |
|
0.23% |
1.41% |
12.46% |
4.96% overvalued |
16.67% |
24.18 |
|
1.03% |
2.52% |
17.86% |
4.91% overvalued |
-5.93% |
25.13 |
|
0.18% |
1.33% |
16.66% |
3.92% overvalued |
10.42% |
29.88 |
|
0.61% |
1.91% |
12.62% |
2.29% overvalued |
19.93% |
22.05 |
|
1.25% |
3.23% |
2.29% |
2.10% overvalued |
4.32% |
18.64 |
|
0.01% |
0.78% |
8.15% |
0.75% overvalued |
8.57% |
16.44 |
|
0.17% |
0.75% |
12.25% |
0.02% undervalued |
-13.90% |
15.54 |
|
-0.19% |
0.57% |
11.36% |
0.56% undervalued |
2.20% |
25.00 |
|
0.11% |
1.06% |
9.60% |
1.50% undervalued |
4.86% |
24.34 |
|
0.15% |
1.06% |
30.45% |
2.09% undervalued |
12.97% |
20.50 |
|
0.87% |
2.45% |
6.87% |
6.31% undervalued |
7.60% |
13.77 |
|
-0.40% |
0.30% |
2.28% |
8.75% undervalued |
-2.51% |
22.67 |
|
0.38% |
1.16% |
1.60% |
9.20% undervalued |
-12.67% |
28.34 |
ValuEngine.com is an independent research provider, producing buy/hold/sell recommendations, target price, and valuations on over 7,000 US and Canadian equities every trading day.
Visit www.ValuEngine.com for more information

|


