November 3, 2016
VALUATION WATCH: Overvalued stocks now make up 40.05% of our stocks assigned a valuation and 11.41% of those equities are calculated to be overvalued by 20% or more. Three sectors are calculated to be overvalued.
If you cannot display this bulletin properly, GO HERE
NASDAQ TURNOVER
--ValuEngine: Applied Materials Remains Dominant on Latest NASDAQ 100 Top- Stock List
ValuEngine tracks more than 7000 US equities, ADRs, and foreign stock which trade on US exchanges as well as @1000 Canadian equities. When EPS estimates are available for a given equity, our model calculates a level of mispricing or valuation percentage for that equity based on earnings estimates and what the stock should be worth if the market were totally rational and efficient--an academic exercise to be sure, but one which allows for useful comparisons between equities, sectors, and industries. Using our Valuation Model, we can currently assign a VE valuation calculation to more than 2800 stocks in our US Universe.
We also use trading data to provide forecast estimates for a variety of time horizons for almost ever equity in our database. Our Buy/Sell/Hold recommendations are based upon the 1-year forecast return figure. Using valuation and forecast figures, you can rank and rate our covered stocks against each other, to find out, in an objective and systematic way, the most attractive investment targets based on your own risk/reward parameters. We re-calculate the entire database every trading day, so you are assured that every proprietary valuation and forecast datapoint is as up-to-date as possible.
We can use our data to track individual stocks, industries, sectors, and indices. For today's bulletin, we present key metrics for the top picks in the NASDAQ 100. The companies listed below represent the top-ten BUY and STRONG BUY stocks within the index. They are presented below according to their one-month forecast target prices.
Like the last time we reported on the NASDAQ back in October, we see very significant turnover in our NASDAQ top-ten list. We have an 80% turnover rate with eight new companies in our list. But, some things have not changed. Applied Materials (AMAT) remains locked in place as our number one NASDAQ stock. We also have LAM Research (LRCX) jumping back up our list going from eighth-to-second.
The eight newcomers this time around are Broadcom, Netease, CA Inc., Cisco Systems, Dollar Tree, NVIDIA Corp., NXP Semiconductors, and Ulta Cosmetics.
We have lost eight positions due to the turnover: CBS,
Johnson Controls, KLA-Tencor, Mallinckrodt, Navient, Scripps Networks, Tyson Foods, and United Rentals.
Ticker |
Company Name |
Market Price |
Valuation |
Last 12-M Retrn |
1-M Forecast Retn |
1-Yr Forecast Retn |
P/E Ratio |
Sector |
10-6-2016 Leaders |
AMAT |
APPLD MATLS INC |
28.59 |
-11.07% |
69.27% |
1.19% |
14.30% |
16.34 |
Computer and Technology |
AMAT |
LRCX |
LAM RESEARCH |
95.85 |
-1.86% |
25.13% |
0.92% |
11.00% |
14.60 |
Computer and Technology |
CBS |
AVGO |
BROADCOM LTD |
172.56 |
-0.47% |
39.39% |
0.87% |
10.40% |
17.79 |
Computer and Technology |
NAVI |
NTES |
NETEASE INC |
242.94 |
1.97% |
68.24% |
0.79% |
9.49% |
20.18 |
Computer and Technology |
URI |
CA |
CA INC |
30.84 |
4.62% |
11.86% |
0.68% |
8.18% |
13.05 |
Computer and Technology |
MNK |
CSCO |
CISCO SYSTEMS |
30.39 |
1.41% |
5.63% |
0.42% |
5.05% |
14.13 |
Computer and Technology |
TSN |
DLTR |
DOLLAR TREE INC |
75.36 |
-7.46% |
13.80% |
0.40% |
4.74% |
22.16 |
Retail-Wholesale |
KLAC |
NVDA |
NVIDIA CORP |
68.76 |
65.72% |
139.58% |
0.37% |
4.50% |
39.52 |
Computer and Technology |
LRCX |
NXPI |
NXP SEMICONDUCT |
99.03 |
9.78% |
29.23% |
0.37% |
4.39% |
24.00 |
Computer and Technology |
SNI |
ULTA |
ULTA SALON COSM |
239.29 |
0.54% |
38.51% |
0.36% |
4.33% |
40.28 |
Retail-Wholesale |
JCI |
NOTE: New stocks are in BOLD, old stocks that have moved up the list are in GREEN, old stocks that have declined in position are in RED, and stocks which have retained their position are in CAPS. AMAT is the only STRONG BUY company in this list. CSCO, NVDA, NXPI, and ULTA are rated HOLD. The other components are rated BUY.
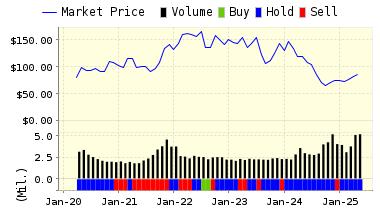
Below is today's data on Dollar Tree (DLTR):
Dollar Tree Stores, Inc is an operator of discount variety stores offering merchandise at a fixed price point of $1.00 or less. Its stores successfully operate in major metropolitan areas, mid-sized cities and small towns and perform well in a variety of locations. They offer a wide range of quality everyday general merchandise in many categories, including housewares, seasonal goods, candy and food, toys, health and beauty care, gifts, party goods, stationery, books, personal accessories, and other consumer items.
VALUENGINE RECOMMENDATION: ValuEngine continues its BUY recommendation on DOLLAR TREE INC for 2016-11-02. Based on the information we have gathered and our resulting research, we feel that DOLLAR TREE INC has the probability to OUTPERFORM average market performance for the next year. The company exhibits ATTRACTIVE Company Size and Sharpe Ratio.
You can download a free copy of detailed report on Dollar Tree (DLTR) from the link below.
ValuEngine Forecast |
| |
Target
Price* |
Expected
Return |
1-Month |
75.66 |
0.40% |
3-Month |
75.69 |
0.44% |
6-Month |
75.90 |
0.71% |
1-Year |
78.93 |
4.74% |
2-Year |
69.42 |
-7.88% |
3-Year |
68.92 |
-8.55% |
Valuation & Rankings |
Valuation |
7.46% undervalued |
|
 57 57 |
1-M Forecast Return |
0.40% |
1-M Forecast Return Rank |
79 |
12-M Return |
13.80% |
|
76 |
Sharpe Ratio |
0.57 |
|
83 |
5-Y Avg Annual Return |
12.73% |
5-Y Avg Annual Rtn Rank |
82 |
Volatility |
22.37% |
|
67 |
Expected EPS Growth |
22.65% |
|
58 |
Market Cap (billions) |
15.50 |
Size Rank |
93 |
Trailing P/E Ratio |
22.16 |
|
53 |
Forward P/E Ratio |
18.07 |
Forward P/E Ratio Rank |
37 |
PEG Ratio |
0.98 |
PEG Ratio Rank |
42 |
Price/Sales |
0.76 |
|
73 |
Market/Book |
3.19 |
|
35 |
Beta |
0.58 |
Beta Rank |
63 |
Alpha |
0.13 |
Alpha Rank |
75 |

DOWNLOAD A FREE SAMPLE OF OUR DOLLAR TREE (DLTR) REPORT BY CLICKING HERE
ValuEngine Market Overview
Summary of VE Stock Universe |
Stocks Undervalued |
59.95% |
Stocks Overvalued |
40.05% |
Stocks Undervalued by 20% |
24.68% |
Stocks Overvalued by 20% |
11.41% |
ValuEngine Sector Overview
|
|
|
|
|
|
|
|
-2.19% |
-2.54% |
28.93% |
1.69% overvalued |
-7.35% |
24.26 |
|
-1.18% |
-2.25% |
12.93% |
0.87% overvalued |
5.16% |
22.05 |
|
-0.81% |
-0.82% |
43.75% |
0.24% overvalued |
50.67% |
28.33 |
|
-1.39% |
-1.62% |
1.52% |
0.57% undervalued |
0.69% |
17.52 |
|
-0.28% |
-0.57% |
6.13% |
0.63% undervalued |
-2.09% |
18.80 |
|
-0.98% |
-1.54% |
13.09% |
1.61% undervalued |
1.56% |
28.17 |
|
-1.70% |
-2.39% |
9.03% |
1.70% undervalued |
7.97% |
21.12 |
|
-1.02% |
-1.80% |
7.81% |
1.72% undervalued |
3.28% |
23.97 |
|
-0.74% |
-1.47% |
4.71% |
3.84% undervalued |
0.20% |
15.70 |
|
-0.43% |
-1.41% |
9.52% |
4.35% undervalued |
-7.04% |
23.98 |
|
-0.58% |
-1.32% |
4.21% |
5.86% undervalued |
-1.01% |
23.14 |
|
-1.02% |
-1.72% |
6.43% |
7.88% undervalued |
-15.80% |
15.44 |
|
-0.51% |
-1.24% |
-3.04% |
8.03% undervalued |
-5.61% |
22.25 |
|
-0.94% |
-1.92% |
25.16% |
8.79% undervalued |
4.05% |
18.59 |
|
-1.57% |
-3.26% |
1.42% |
12.84% undervalued |
1.02% |
12.99 |
|
-1.15% |
-1.89% |
-4.12% |
15.49% undervalued |
-16.14% |
24.82 |
ValuEngine.com is an independent research provider, producing buy/hold/sell recommendations, target price, and valuations on over 7,000 US and Canadian equities every trading day.
Visit www.ValuEngine.com for more information

|


