
December 27, 2016VALUATION WARNING: Overvalued stocks now make up 65.84% of our stocks assigned a valuation and 34.71% of those equities are calculated to be overvalued by 20% or more. Fifteen sectors are calculated to be overvalued. Editor's Note: Starting Wednesday, December 21st, we will be on a limited publication schedule. We will resume our normal full publication schedule on Tuesday, January 3rd. HAPPY HOLIDAYS FROM VALUENGINE!!!
|
|||||||||||||||||||||||||||||||||||||||||||||||||||||||||||||||||||||||||||||||||||||||||||||||||||||||||||||||||||||||||||||||||||||||||||||||||||||||||||||||||||||||||||||||||||||||||||||||||||||||||||||||||||||||||||||||||||||||||||||||||||||||||||||||||||||||||||||||||

Ticker |
Company Name |
Market Price |
Valuation |
Last 12-M Return |
1-M Forecast Return |
1-Yr Forecast Return |
P/E Ratio |
Sector Name |
FRP |
FAIRPOINT COMM |
19.3 |
8.16% |
20.62% |
1.10% |
13.25% |
4.31 |
Computer and Technology |
CATC |
CAMBRIDGE BANCP |
61.99 |
N/A |
30.51% |
0.53% |
6.32% |
18.08 |
Finance |
WEB |
WEB.COM GROUP |
20.75 |
-8.67% |
-0.29% |
0.51% |
6.13% |
8.91 |
Computer and Technology |
BSET |
BASSETT FURNITR |
30.55 |
7.55% |
21.76% |
0.51% |
6.11% |
18.40 |
Consumer Discretionary |
ARRS |
ARRIS INTL PLC |
30.56 |
-0.67% |
3.91% |
0.51% |
6.08% |
12.05 |
Computer and Technology |
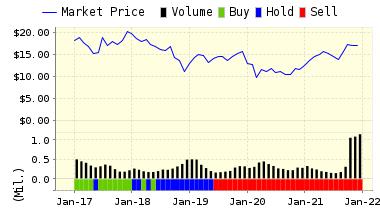
Below is today's data on Fairpoint Communications (FRP):
FairPoint Communications, Inc. operates as a provider of communications services to rural and small urban communities, primarily in northern New England. Services offered by the Company includes including local and long distance voice, data, Internet, television and broadband services. The Company operates local exchange companies and also offers video services to its customers by reselling DirectTV content and providing cable and IP television video over digital subscriber line (DSL). FairPoint Communications, Inc. is headquartered in Charlotte, North Carolina.
VALUENGINE RECOMMENDATION: ValuEngine updated its recommendation from BUY to STRONG BUY for Fairpoint Communications on 2016-12-23. Based on the information we have gathered and our resulting research, we feel that Fairpoint Communications has the probability to OUTPERFORM average market performance for the next year. The company exhibits ATTRACTIVE P/E Ratio and Sharpe Ratio.
You can download a free copy of detailed report on Fairpoint Communications (FRP) from the link below.
ValuEngine Forecast |
||
Target Price* |
Expected Return |
|
|---|---|---|
1-Month |
19.51 | 1.10% |
3-Month |
19.76 | 2.40% |
6-Month |
19.97 | 3.47% |
1-Year |
21.86 | 13.25% |
2-Year |
21.18 | 9.74% |
3-Year |
21.31 | 10.44% |
Valuation & Rankings |
|||
Valuation |
8.16% overvalued |
Valuation Rank(?) |
|
1-M Forecast Return |
1.10% |
1-M Forecast Return Rank |
|
12-M Return |
20.62% |
Momentum Rank(?) |
|
Sharpe Ratio |
0.85 |
Sharpe Ratio Rank(?) |
|
5-Y Avg Annual Return |
25.09% |
5-Y Avg Annual Rtn Rank |
|
Volatility |
29.40% |
Volatility Rank(?) |
|
Expected EPS Growth |
-134.80% |
EPS Growth Rank(?) |
|
Market Cap (billions) |
0.52 |
Size Rank |
|
Trailing P/E Ratio |
4.31 |
Trailing P/E Rank(?) |
|
Forward P/E Ratio |
n/a |
Forward P/E Ratio Rank |
|
PEG Ratio |
n/a |
PEG Ratio Rank |
|
Price/Sales |
0.62 |
Price/Sales Rank(?) |
|
Market/Book |
n/a |
Market/Book Rank(?) |
|
Beta |
0.26 |
Beta Rank |
|
Alpha |
-0.11 |
Alpha Rank |
|

DOWNLOAD A FREE SAMPLE OF OUR FAIRPOINT COMMUNICATIONS (FRP) REPORT BY CLICKING HERE
ValuEngine Market Overview
Summary of VE Stock Universe |
|
Stocks Undervalued |
34.16% |
Stocks Overvalued |
65.84% |
Stocks Undervalued by 20% |
15.58% |
Stocks Overvalued by 20% |
34.71% |
ValuEngine Sector Overview
Sector
|
Change
|
MTD
|
YTD
|
Valuation
|
Last 12-MReturn
|
P/E Ratio
|
0.00% |
2.08% |
13.40% |
22.27% overvalued |
11.53% |
20.12 |
|
0.00% |
2.93% |
28.08% |
22.12% overvalued |
21.79% |
23.97 |
|
0.00% |
4.28% |
32.96% |
20.48% overvalued |
23.33% |
26.04 |
|
-0.00% |
3.28% |
18.00% |
18.38% overvalued |
12.94% |
18.23 |
|
0.00% |
2.04% |
19.50% |
17.41% overvalued |
8.86% |
18.58 |
|
0.00% |
-0.51% |
12.14% |
16.13% overvalued |
14.31% |
19.66 |
|
0.00% |
2.52% |
25.22% |
12.74% overvalued |
5.99% |
24.09 |
|
0.00% |
-0.31% |
50.81% |
12.56% overvalued |
59.10% |
26.66 |
|
0.00% |
2.24% |
37.96% |
12.45% overvalued |
20.85% |
20.57 |
|
-0.04% |
2.33% |
23.36% |
12.38% overvalued |
10.75% |
29.81 |
|
0.00% |
3.08% |
16.37% |
10.49% overvalued |
16.09% |
22.08 |
|
0.00% |
1.66% |
12.49% |
8.73% overvalued |
18.84% |
14.86 |
|
0.00% |
3.01% |
10.86% |
7.08% overvalued |
9.10% |
24.16 |
|
0.00% |
0.27% |
3.64% |
6.98% overvalued |
4.51% |
23.42 |
|
0.00% |
2.11% |
12.25% |
6.77% overvalued |
13.30% |
23.45 |
|
0.00% |
0.99% |
0.47% |
3.13% undervalued |
-11.05% |
28.09 |
Visit www.ValuEngine.com for more information

