January 9, 2017
VALUATION WARNING: Overvalued stocks now make up 66.64% of our stocks assigned a valuation and 31.13% of those equities are calculated to be overvalued by 20% or more. Fifteen sectors are calculated to be overvalued.
If you cannot display this bulletin properly, GO HERE
All Systems Are Go
--China Auto Systems Leads ValuEngine Top Upgrade List
ValuEngine tracks more than 7000 US equities, ADRs, and foreign stock which trade on US exchanges as well as @1000 Canadian equities. When EPS estimates are available for a given equity, our model calculates a level of mispricing or valuation percentage for that equity based on earnings estimates and what the stock should be worth if the market were totally rational and efficient--an academic exercise to be sure, but one which allows for useful comparisons between equities, sectors, and industries. Using our Valuation Model, we can currently assign a VE valuation calculation to more than 2800 stocks in our US Universe.
We combine all of the equities with a valuation calculation to track market valuation figures and use them as a metric for making calls about the overall state of the market. Two factors can lower these figures-- a market pullback, or a significant rise in EPS estimates.
We also use trading data to provide forecast estimates for a variety of time horizons for almost ever equity in our database. Our Buy/Sell/Hold recommendations are based upon the 1-year forecast return figure. Using valuation and forecast figures, you can rank and rate our covered stocks against each other, to find out, in an objective and systematic way, the most attractive investment targets based on your own risk/reward parameters. We re-calculate the entire database every trading day, so you are assured that every proprietary valuation and forecast datapoint is as up-to-date as possible.
For today's edition of our upgrade list, we used our website's advanced screening functions to search for UPGRADES to BUY or STRONG BUY with complete forecast and valuation data. They are presented by one-month forecast return. China Automotive Systems, Inc (CAAS) is our top-rated upgrade this week and it is a STRONG BUY. The rest of the components on our list are BUY-rated companies.
Ticker |
Company Name |
Market Price |
Valuation |
Last 12-M Return |
1-M Forecast Return |
1-Yr Forecast Return |
P/E Ratio |
Sector Name |
CAAS |
CHINA AUTO SYS |
5.5 |
0.19% |
28.81% |
1.12% |
13.51% |
7.64 |
Auto-Tires-Trucks |
ABG |
ASBURY AUTO GRP |
61.75 |
-13.71% |
7.69% |
0.59% |
7.09% |
10.36 |
Retail-Wholesale |
TOO |
TEEKAY OFFSHORE |
5.57 |
-64.04% |
1.64% |
0.55% |
6.62% |
7.63 |
Transportation |
SAH |
SONIC AUTOMOTVE |
22.65 |
2.21% |
8.32% |
0.53% |
6.35% |
11.56 |
Retail-Wholesale |
LAD |
LITHIA MOTORS |
99.6 |
-5.59% |
11.83% |
0.52% |
6.24% |
13.39 |
Retail-Wholesale |
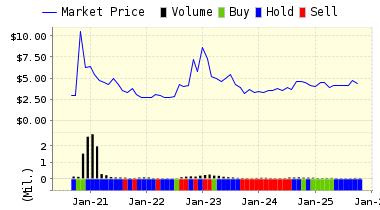
Below is today's data on China Automotive Systems, Inc (CAAS):
China Automotive Systems, Inc., (China Automotive) is a holding company. The Company, through its subsidiary, Great Genesis Holdings Limited (Genesis), owns interests in over eight Sino-joint ventures and over five subsidiaries in the People's Republic of China (PRC), which manufacture power steering systems and/or related products for various segments of the automobile industry. Genesis also owns interests in a Brazil-based trading company, which engages mainly in the import and sales of automotive parts in Brazil. Henglong USA Corporation (HLUSA), which is a subsidiary of the Company, engages in marketing of automotive parts in North America, and provides after sales service and research and development support. The Company's geographical segments include the United States, China and other foreign countries. One of its subsidiaries, Shenyang Jinbei Henglong Automotive Steering System Co., Ltd., focuses on power steering parts for light duty vehicles.
VALUENGINE RECOMMENDATION: ValuEngine updated its recommendation from BUY to STRONG BUY for China Automotive Systems on 2017-01-06. Based on the information we have gathered and our resulting research, we feel that China Automotive Systems has the probability to OUTPERFORM average market performance for the next year. The company exhibits ATTRACTIVE P/E Ratio and Book Market Ratio.
You can download a free copy of detailed report on China Automotive Systems, Inc (CAAS) from the link below.
ValuEngine Forecast |
| |
Target
Price* |
Expected
Return |
1-Month |
5.56 |
1.12% |
3-Month |
5.59 |
1.57% |
6-Month |
5.64 |
2.50% |
1-Year |
6.24 |
13.51% |
2-Year |
5.54 |
0.81% |
3-Year |
5.16 |
-6.26% |
Valuation & Rankings |
Valuation |
0.19% overvalued |
|
 67 67 |
1-M Forecast Return |
1.12% |
1-M Forecast Return Rank |
99 |
12-M Return |
28.81% |
|
69 |
Sharpe Ratio |
0.17 |
|
62 |
5-Y Avg Annual Return |
9.70% |
5-Y Avg Annual Rtn Rank |
72 |
Volatility |
56.80% |
|
30 |
Expected EPS Growth |
13.89% |
|
47 |
Market Cap (billions) |
0.15 |
Size Rank |
40 |
Trailing P/E Ratio |
7.64 |
|
97 |
Forward P/E Ratio |
6.71 |
Forward P/E Ratio Rank |
95 |
PEG Ratio |
0.55 |
PEG Ratio Rank |
58 |
Price/Sales |
0.36 |
|
89 |
Market/Book |
0.49 |
|
92 |
Beta |
2.64 |
Beta Rank |
6 |
Alpha |
-0.08 |
Alpha Rank |
31 |

DOWNLOAD A FREE SAMPLE OF OUR CHINA AUTOMATIVE SYSTEMS (CAAS) REPORT BY CLICKING HERE
ValuEngine Market Overview
Summary of VE Stock Universe |
Stocks Undervalued |
33.36% |
Stocks Overvalued |
66.64% |
Stocks Undervalued by 20% |
14.06% |
Stocks Overvalued by 20% |
31.13% |
ValuEngine Sector Overview
|
|
|
|
|
|
|
|
-0.11% |
2.75% |
2.75% |
21.46% overvalued |
35.39% |
26.91 |
|
-0.14% |
1.37% |
1.37% |
18.27% overvalued |
17.72% |
19.95 |
|
-0.37% |
0.94% |
0.94% |
17.85% overvalued |
27.06% |
24.62 |
|
0.08% |
1.34% |
1.34% |
16.49% overvalued |
17.08% |
18.25 |
|
0.07% |
2.64% |
2.64% |
15.57% overvalued |
12.23% |
20.92 |
|
-1.38% |
2.73% |
2.71% |
12.43% overvalued |
74.08% |
27.90 |
|
0.15% |
2.55% |
2.55% |
11.77% overvalued |
18.06% |
18.40 |
|
-0.25% |
0.69% |
0.69% |
11.52% overvalued |
11.87% |
24.17 |
|
-0.67% |
1.90% |
1.90% |
11.35% overvalued |
20.36% |
21.89 |
|
-0.49% |
1.30% |
1.30% |
10.86% overvalued |
25.93% |
21.49 |
|
0.02% |
1.54% |
2.12% |
8.83% overvalued |
16.76% |
31.18 |
|
-0.09% |
1.72% |
1.72% |
8.07% overvalued |
28.64% |
15.02 |
|
-0.16% |
0.91% |
0.91% |
5.94% overvalued |
12.63% |
24.06 |
|
-0.33% |
1.22% |
1.22% |
4.90% overvalued |
19.36% |
23.73 |
|
-0.95% |
0.43% |
0.43% |
2.73% overvalued |
6.99% |
22.92 |
|
-0.07% |
3.48% |
3.48% |
4.96% undervalued |
-5.29% |
28.57 |
ValuEngine.com is an independent research provider, producing buy/hold/sell recommendations, target price, and valuations on over 7,000 US and Canadian equities every trading day.
Visit www.ValuEngine.com for more information

|


