March 1, 2016
VALUATION WATCH: Overvalued stocks now make up 30.1% of our stocks assigned a valuation and 6.83% of those equities are calculated to be overvalued by 20% or more. Two sectors are calculated to be overvalued.
Leaping Into Great Sales
US Auto Sales Still Strong In February
We continue to find more good news for auto manufacturers as the preliminary sales results indicate that they had their best February in 15 years. February was nice for big auto makers because it included an extra day--thanks to leap year, some pent up demand due to bad weather in January, and lots of President's Day sales led to great numbers for many.
Fiat/Chrysler posted a 12% gain,
Nissan was similar with an 11% increase, and Ford led the way with a giant 20% leap in February sales. Ford did great thanks to sales of its hugely popular F-Series trucks and other SUVs.
On the other hand, Volkswagen is in trouble in the US due to the continued fallout from their emissions-cheating scandal. GM also had some trouble, with a slight dip in sales year-over-year--1.5%.
As we have reported over the past few months, low interest rates, a better overall labor market, and low gas prices are making the bigger cars, SUVs, and trucks popular once again. Those vehicles are the most-profitable for manufacturers, so this environment is particularly kind to the bottom line.
Of course, one wonders how long this trend can continue, given the fact that the big profits are based on vehicles which will most certainly fall out of favor as soon as gas prices return to more "normal" levels. Drivers seem to have short memories. But investors should remember the sort of angst out there when people were trying to fill the tanks of Hummers at $5/gallon.
When we query our systems for the auto industry today, we find the following data on the firms discussed above and a few other top companies. Complete data, including BUY/SELL/HOLD recommendations, are available at ValuEngine.com. Members can always screen for these stocks using our advanced screening page HERE.
Ticker |
Company Name |
Market Price |
Valuation |
Last 12-M Retrn |
1-M Forecast Retn |
1-Yr Forecast Retn |
P/E Ratio |
Country Code |
DDAIF |
DAIMLER AG |
67.97 |
N/A |
-29.40% |
N/A |
N/A |
7.66 |
DEU |
F |
FORD MOTOR CO |
12.51 |
-21.53% |
-23.44% |
0.71% |
8.53% |
6.94 |
USA |
FCAU |
FIAT CHRYSLER |
6.85 |
N/A |
-55.55% |
N/A |
N/A |
4.74 |
ITA |
GM |
GENERAL MOTORS |
29.44 |
-8.28% |
-21.09% |
0.79% |
9.44% |
5.78 |
USA |
HMC |
HONDA MOTOR |
25.71 |
-26.46% |
-22.42% |
0.48% |
5.79% |
10.31 |
JPN |
ISUZY |
ISUZU MOTORS |
9.98 |
N/A |
-31.83% |
N/A |
N/A |
9.06 |
JPN |
NSANY |
NISSAN ADR |
18.09 |
-12.61% |
-13.98% |
0.90% |
10.77% |
7.72 |
JPN |
TM |
TOYOTA MOTOR CP |
104.1 |
-21.39% |
-23.10% |
0.60% |
7.18% |
8.42 |
JPN |
TSLA |
TESLA MOTORS |
191.93 |
35.28% |
-5.61% |
-0.28% |
-3.41% |
N/A |
USA |
VLKAY |
VOLKSWAGEN-ADR |
27.42 |
N/A |
-45.38% |
N/A |
N/A |
6.53 |
DEU |
Here Is complete data on one of our top Auto stocks:
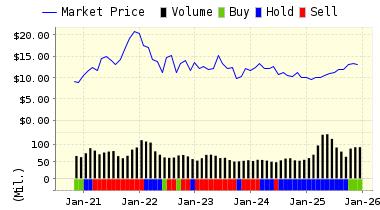
Ford Motor Company (F) produces cars and trucks. The company and its subsidiaries also engage in other businesses, including manufacturing automotive components and systems and financing and renting vehicles and equipment. The company is divided up into the following four operating segments: Automotive, Visteon Automotive Systems, Ford Motor Credit Company, and The Hertz Corporation.
ValuEngine continues its BUY recommendation on FORD MOTOR CO for 2016-02-29. Based on the information we have gathered and our resulting research, we feel that FORD MOTOR CO has the probability to OUTPERFORM average market performance for the next year. The company exhibits ATTRACTIVE Company Size and P/E Ratio.
You can download a free copy of detailed report on Ford from the link below.
ValuEngine Forecast |
| |
Target
Price* |
Expected
Return |
1-Month |
12.60 |
0.71% |
3-Month |
12.74 |
1.82% |
6-Month |
12.72 |
1.65% |
1-Year |
13.58 |
8.53% |
2-Year |
12.72 |
1.67% |
3-Year |
12.71 |
1.59% |
Valuation & Rankings |
Valuation |
21.53% undervalued |
|
 67 67 |
1-M Forecast Return |
0.71% |
1-M Forecast Return Rank |
92 |
12-M Return |
-23.44% |
|
41 |
Sharpe Ratio |
-0.22 |
|
45 |
5-Y Avg Annual Return |
-5.79% |
5-Y Avg Annual Rtn Rank |
48 |
Volatility |
25.86% |
|
64 |
Expected EPS Growth |
8.32% |
|
43 |
Market Cap (billions) |
48.15 |
Size Rank |
99 |
Trailing P/E Ratio |
6.94 |
|
95 |
Forward P/E Ratio |
6.40 |
Forward P/E Ratio Rank |
92 |
PEG Ratio |
0.83 |
PEG Ratio Rank |
48 |
Price/Sales |
0.32 |
|
86 |
Market/Book |
1.68 |
|
52 |
Beta |
1.37 |
Beta Rank |
26 |
Alpha |
-0.17 |
Alpha Rank |
36 |

DOWNLOAD A FREE SAMPLE OF OUR FORD (F) REPORT BY CLICKING HERE
ValuEngine Market Overview
Summary of VE Stock Universe |
Stocks Undervalued |
69.81% |
Stocks Overvalued |
30.19% |
Stocks Undervalued by 20% |
35.43% |
Stocks Overvalued by 20% |
9.67% |
ValuEngine Sector Overview
|
|
|
|
|
|
|
|
-0.29% |
0.82% |
-1.59% |
2.93% overvalued |
-4.18% |
24.57 |
|
-0.28% |
1.88% |
-0.36% |
1.78% overvalued |
-7.93% |
21.77 |
|
0.46% |
1.84% |
-5.29% |
3.80% undervalued |
-17.37% |
16.92 |
|
0.49% |
8.10% |
-0.62% |
4.46% undervalued |
-17.86% |
25.84 |
|
0.41% |
2.57% |
-5.27% |
5.49% undervalued |
-18.92% |
15.53 |
|
0.48% |
-1.00% |
-9.22% |
5.79% undervalued |
-18.42% |
20.04 |
|
0.46% |
1.86% |
-1.36% |
7.14% undervalued |
-12.25% |
25.63 |
|
0.28% |
-0.41% |
-5.59% |
7.98% undervalued |
-15.00% |
20.84 |
|
0.57% |
2.13% |
-4.29% |
10.06% undervalued |
-11.38% |
23.59 |
|
0.40% |
-0.40% |
-7.01% |
10.08% undervalued |
-10.88% |
15.00 |
|
0.52% |
3.53% |
-3.32% |
13.12% undervalued |
-15.22% |
22.67 |
|
0.84% |
2.08% |
-5.99% |
13.31% undervalued |
-13.54% |
17.98 |
|
0.75% |
2.45% |
-5.97% |
17.07% undervalued |
-28.23% |
12.21 |
|
1.50% |
-3.82% |
-11.48% |
17.10% undervalued |
-43.70% |
20.84 |
|
1.06% |
-0.55% |
-12.44% |
17.38% undervalued |
-24.84% |
26.59 |
|
0.37% |
0.52% |
-8.21% |
18.80% undervalued |
-24.99% |
11.17 |
ValuEngine.com is an independent research provider, producing buy/hold/sell recommendations, target price, and valuations on over 7,000 US and Canadian equities every trading day.
Visit www.ValuEngine.com for more information

|


