March 31, 2016
VALUATION WATCH: Overvalued stocks now make up 43.95% of our stocks assigned a valuation and 14.23% of those equities are calculated to be overvalued by 20% or more. Five sectors are calculated to be overvalued.
Indexing
--ValuEngine Rates and Ranks the S&P500
ValuEngine tracks more than 7000 US equities, ADRs, and foreign stock which trade on US exchanges as well as @1000 Canadian equities. When EPS estimates are available for a given equity, our model calculates a level of mispricing or valuation percentage for that equity based on earnings estimates and what the stock should be worth if the market were totally rational and efficient--an academic exercise to be sure, but one which allows for useful comparisons between equities, sectors, and industries. Using our Valuation Model, we can currently assign a VE valuation calculation to more than 2800 stocks in our US Universe.
We also use trading data to provide forecast estimates for a variety of time horizons for almost ever equity in our database. Our Buy/Sell/Hold recommendations are based upon the 1-year forecast return figure. Using valuation and forecast figures, you can rank and rate our covered stocks against each other, to find out, in an objective and systematic way, the most attractive investment targets based on your own risk/reward parameters. We re-calculate the entire database every trading day, so you are assured that every proprietary valuation and forecast datapoint is as up-to-date as possible.
We can use our data to track individual stocks, industries, sectors, and indices. For today's bulletin, we present key metrics for the top picks in the S&P 500. The companies listed below represent the top-ten BUY/STRONG BUY stocks within the index. They are presented below according to their one-month forecast target prices.
The components of this list are farily similar to the last time we presented the top S&P picks in February. Our leader is still Akron's Finest., Goodyear Tire. Delta, Assurant, and Phillips 66 have moved up, Valero, First Solar, and Travelers have declined slightly. We have two newcomers, Eastman Chemical and LAM Research. Our list is still dominated by Finance and Oil/Energy firms. .
Ticker |
Company Name |
Market Price |
Valuation |
Last 12-M Retrn |
1-M Forecast Retn |
1-Yr Forecast Retn |
P/E Ratio |
Sector Name |
Last Month Top Ten |
GT |
GOODYEAR TIRE |
32.77 |
3.29% |
22.32% |
1.40% |
16.93% |
9.62 |
Auto-Tires-Trucks |
GT |
DAL |
DELTA AIR LINES |
49.33 |
-20.95% |
8.27% |
1.22% |
14.68% |
9.50 |
Transportation |
VLO |
AIZ |
ASSURANT INC |
78.36 |
28.80% |
27.19% |
1.21% |
14.59% |
13.31 |
Finance |
DAL |
VLO |
VALERO ENERGY |
63.98 |
-2.50% |
0.35% |
1.18% |
14.18% |
7.36 |
Oils-Energy |
FSLR |
FSLR |
FIRST SOLAR INC |
68.97 |
39.89% |
13.64% |
1.18% |
14.16% |
11.96 |
Oils-Energy |
TRV |
TRV |
TRAVELERS COS |
117.43 |
5.79% |
7.11% |
1.14% |
13.76% |
10.79 |
Finance |
AIZ |
PSX |
PHILLIPS 66 |
87.62 |
25.95% |
10.13% |
1.14% |
13.67% |
11.86 |
Oils-Energy |
TSO |
HIG |
HARTFORD FIN SV |
46.31 |
11.21% |
9.30% |
1.11% |
13.38% |
11.96 |
Finance |
HIG |
EMN |
EASTMAN CHEM CO |
73.27 |
-10.13% |
4.08% |
1.08% |
13.00% |
10.37 |
Basic Materials |
AFL |
LRCX |
LAM RESEARCH |
82.19 |
-2.48% |
13.85% |
1.04% |
12.52% |
13.48 |
Computer and Technology |
PSX |
NOTE: New stocks are in BOLD, old stocks that have moved up the list are in GREEN, old stocks that have declined in position are in RED, and stocks which have retained their position are in CAPS.
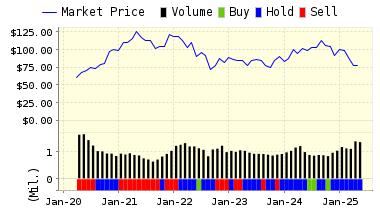
Below is today's data on one of our newcomers, Eastman Chemical (EMN):
Eastman Chemical Company is a global chemical company with a broad portfolio of chemical, plastic, and fiber products. The company manufactures and sells chemicals and specialty polymers supplied to the inks, coatings, adhesives, sealants, and textile industries; fine chemicals; performance chemicals and intermediates; specialty plastics; polyester plastics such as polyethylene terephthalate sold under the trademark EASTAPAK polymers; and fibers.
VALUENGINE RECOMMENDATION: ValuEngine continues its STRONG BUY recommendation on EASTMAN CHEM CO for 2016-03-30. Based on the information we have gathered and our resulting research, we feel that EASTMAN CHEM CO has the probability to OUTPERFORM average market performance for the next year. The company exhibits ATTRACTIVE Company Size and P/E Ratio. .
You can download a free copy of detailed report on GT from the link below.
ValuEngine Forecast |
| |
Target
Price* |
Expected
Return |
1-Month |
74.06 |
1.08% |
3-Month |
74.66 |
1.90% |
6-Month |
75.52 |
3.07% |
1-Year |
82.80 |
13.00% |
2-Year |
76.39 |
4.26% |
3-Year |
71.16 |
-2.88% |
Valuation & Rankings |
Valuation |
10.13% undervalued |
|
 62 62 |
1-M Forecast Return |
1.08% |
1-M Forecast Return Rank |
98 |
12-M Return |
4.08% |
|
75 |
Sharpe Ratio |
0.23 |
|
77 |
5-Y Avg Annual Return |
6.35% |
5-Y Avg Annual Rtn Rank |
78 |
Volatility |
27.10% |
|
62 |
Expected EPS Growth |
5.09% |
|
35 |
Market Cap (billions) |
10.88 |
Size Rank |
91 |
Trailing P/E Ratio |
10.37 |
|
88 |
Forward P/E Ratio |
9.87 |
Forward P/E Ratio Rank |
80 |
PEG Ratio |
2.04 |
PEG Ratio Rank |
23 |
Price/Sales |
1.13 |
|
61 |
Market/Book |
2.71 |
|
39 |
Beta |
1.70 |
Beta Rank |
17 |
Alpha |
-0.00 |
Alpha Rank |
59 |

DOWNLOAD A FREE SAMPLE OF OUR EASTMAN CHEMICAL (EMN) REPORT BY CLICKING HERE
ValuEngine Market Overview
Summary of VE Stock Universe |
Stocks Undervalued |
56.05% |
Stocks Overvalued |
43.95% |
Stocks Undervalued by 20% |
25.16% |
Stocks Overvalued by 20% |
14.23% |
ValuEngine Sector Overview
|
|
|
|
|
|
|
|
0.65% |
6.44% |
7.34% |
10.92% overvalued |
-1.28% |
23.95 |
|
0.54% |
5.20% |
3.49% |
8.65% overvalued |
-1.88% |
24.47 |
|
0.13% |
12.13% |
15.22% |
6.51% overvalued |
-5.71% |
25.27 |
|
0.39% |
9.23% |
3.47% |
6.38% overvalued |
-11.11% |
17.42 |
|
0.46% |
10.34% |
4.72% |
3.93% overvalued |
-12.78% |
18.25 |
|
0.31% |
6.12% |
3.87% |
0.07% undervalued |
-7.36% |
27.10 |
|
0.82% |
8.21% |
2.27% |
0.32% undervalued |
-10.53% |
22.15 |
|
0.55% |
5.54% |
-2.44% |
1.61% undervalued |
-12.71% |
19.65 |
|
0.01% |
13.06% |
1.30% |
2.36% undervalued |
-15.24% |
13.19 |
|
0.12% |
6.98% |
2.48% |
3.38% undervalued |
-9.24% |
25.10 |
|
0.35% |
6.14% |
-1.70% |
3.96% undervalued |
-6.56% |
15.65 |
|
-0.12% |
9.44% |
3.24% |
4.91% undervalued |
-4.25% |
20.00 |
|
0.72% |
4.93% |
1.23% |
5.01% undervalued |
-12.49% |
23.00 |
|
0.96% |
12.09% |
1.60% |
7.45% undervalued |
-36.32% |
22.32 |
|
0.33% |
7.43% |
1.09% |
9.17% undervalued |
-24.00% |
13.52 |
|
0.20% |
4.87% |
-9.71% |
12.66% undervalued |
-21.89% |
26.85 |
ValuEngine.com is an independent research provider, producing buy/hold/sell recommendations, target price, and valuations on over 7,000 US and Canadian equities every trading day.
Visit www.ValuEngine.com for more information

|


