May 12, 2016
VALUATION WATCH: Overvalued stocks now make up 41.84% of our stocks assigned a valuation and 13.6% of those equities are calculated to be overvalued by 20% or more. Six sectors are calculated to be overvalued.
Indexing
--ValuEngine Rates and Ranks the S&P500
ValuEngine tracks more than 7000 US equities, ADRs, and foreign stock which trade on US exchanges as well as @1000 Canadian equities. When EPS estimates are available for a given equity, our model calculates a level of mispricing or valuation percentage for that equity based on earnings estimates and what the stock should be worth if the market were totally rational and efficient--an academic exercise to be sure, but one which allows for useful comparisons between equities, sectors, and industries. Using our Valuation Model, we can currently assign a VE valuation calculation to more than 2800 stocks in our US Universe.
We also use trading data to provide forecast estimates for a variety of time horizons for almost ever equity in our database. Our Buy/Sell/Hold recommendations are based upon the 1-year forecast return figure. Using valuation and forecast figures, you can rank and rate our covered stocks against each other, to find out, in an objective and systematic way, the most attractive investment targets based on your own risk/reward parameters. We re-calculate the entire database every trading day, so you are assured that every proprietary valuation and forecast datapoint is as up-to-date as possible.
We can use our data to track individual stocks, industries, sectors, and indices. For today's bulletin, we present key metrics for the top picks in the S&P 500. The companies listed below represent the top-ten BUY/STRONG BUY stocks within the index. They are presented below according to their one-month forecast target prices.
For the first time in a while, we have a good bit of turnover in our list. Traveler's returns to the top while Tyson Foods and Hartford Financial move up from the last time we presented the top S&P picks in April Assurant has declined to third position. Meanwhile, Goodyear, Valero, LAM Research, Delta Airlines, and Southwest Airlines have fallen out of the top-ten. second-place spot. Our newcomers this week are DR Horton, Chubb LTD, AFLAC, Broadcom LTD, and KLA-Tencor.
Ticker |
Company Name |
Market Price |
Valuation |
Last 12-M Retrn |
1-M Forecast Retn |
1-Yr Forecast Retn |
P/E Ratio |
Sector Name |
Last Month Top Ten |
TRV |
TRAVELERS COS |
111.97 |
-1.97% |
9.54% |
1.10% |
13.24% |
10.55 |
Finance |
GT |
DHI |
D R HORTON INC |
29.12 |
-5.26% |
14.47% |
1.07% |
12.86% |
13.22 |
Construction |
AIZ |
AIZ |
ASSURANT INC |
86.39 |
29.76% |
33.13% |
1.06% |
12.71% |
14.24 |
Finance |
VLO |
CB |
CHUBB LTD |
123.76 |
6.18% |
14.30% |
1.00% |
12.06% |
13.06 |
Finance |
TRV |
TSN |
TYSON FOODS A |
68.48 |
13.18% |
65.53% |
1.00% |
12.04% |
17.59 |
Consumer Staples |
LRCX |
T |
AT&T INC |
39.18 |
2.21% |
16.99% |
0.99% |
11.92% |
14.06 |
Utilities |
TSN |
AFL |
AFLAC INC |
68.76 |
15.60% |
7.62% |
0.95% |
11.34% |
10.74 |
Finance |
T |
HIG |
HARTFORD FIN SV |
44.26 |
8.60% |
6.39% |
0.91% |
10.87% |
11.75 |
Finance |
DAL |
AVGO |
BROADCOM LTD |
143.85 |
-9.51% |
17.13% |
0.88% |
10.59% |
16.71 |
Computer and Technology |
LUV |
KLAC |
KLA-TENCOR CORP |
69.7 |
-13.25% |
16.93% |
0.86% |
10.33% |
17.27 |
Computer and Technology |
HIG |
NOTE: New stocks are in BOLD, old stocks that have moved up the list are in GREEN, old stocks that have declined in position are in RED, and stocks which have retained their position are in CAPS.
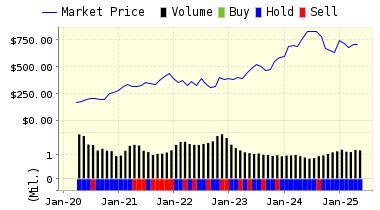
Below is today's data on one of our newcomers, KLA-Tencor (KLAC):
KLA-Tencor Corporation is one of the world's leading suppliers of process control and yield management solutions for the semiconductor and related microelectronics industries. Its comprehensive portfolio of products, software, analysis, services and expertise is designed to help integrated circuit manufacturers manage yield throughout the entire wafer fabrication process.
VALUENGINE RECOMMENDATION: ValuEngine continues its BUY recommendation on KLA-TENCOR CORP for 2016-05-11. Based on the information we have gathered and our resulting research, we feel that KLA-TENCOR CORP has the probability to OUTPERFORM average market performance for the next year. The company exhibits ATTRACTIVE Company Size and Momentum.
You can download a free copy of detailed report on TSN from the link below.
ValuEngine Forecast |
| |
Target
Price* |
Expected
Return |
1-Month |
70.30 |
0.86% |
3-Month |
70.11 |
0.59% |
6-Month |
69.88 |
0.26% |
1-Year |
76.90 |
10.33% |
2-Year |
65.51 |
-6.01% |
3-Year |
51.97 |
-25.43% |
Valuation & Rankings |
Valuation |
13.25% undervalued |
|
 67 67 |
1-M Forecast Return |
0.86% |
1-M Forecast Return Rank |
95 |
12-M Return |
16.93% |
|
85 |
Sharpe Ratio |
0.35 |
|
80 |
5-Y Avg Annual Return |
9.31% |
5-Y Avg Annual Rtn Rank |
81 |
Volatility |
26.44% |
|
64 |
Expected EPS Growth |
31.79% |
|
69 |
Market Cap (billions) |
11.34 |
Size Rank |
92 |
Trailing P/E Ratio |
17.27 |
|
66 |
Forward P/E Ratio |
13.10 |
Forward P/E Ratio Rank |
64 |
PEG Ratio |
0.54 |
PEG Ratio Rank |
59 |
Price/Sales |
4.02 |
|
22 |
Market/Book |
83.53 |
|
2 |
Beta |
1.41 |
Beta Rank |
25 |
Alpha |
0.19 |
Alpha Rank |
86 |

DOWNLOAD A FREE SAMPLE OF OUR KLA-TENCOR (KLAC) REPORT BY CLICKING HERE
ValuEngine Market Overview
Summary of VE Stock Universe |
Stocks Undervalued |
58.16% |
Stocks Overvalued |
41.84% |
Stocks Undervalued by 20% |
25.4% |
Stocks Overvalued by 20% |
13.6% |
ValuEngine Sector Overview
|
|
|
|
|
|
|
|
-0.31% |
-0.10% |
6.74% |
8.45% overvalued |
-0.43% |
23.51 |
|
-0.73% |
-0.20% |
5.58% |
8.02% overvalued |
-0.82% |
24.06 |
|
0.62% |
-3.78% |
28.76% |
7.80% overvalued |
10.52% |
28.71 |
|
-0.40% |
-1.39% |
5.58% |
4.20% overvalued |
-11.58% |
20.12 |
|
-0.63% |
-1.27% |
3.48% |
3.30% overvalued |
-8.36% |
17.14 |
|
-0.02% |
0.02% |
-2.57% |
0.78% overvalued |
-8.46% |
18.63 |
|
0.63% |
-6.02% |
8.48% |
1.53% undervalued |
-37.61% |
21.64 |
|
-0.49% |
-0.74% |
17.00% |
2.16% undervalued |
-5.85% |
20.66 |
|
-0.49% |
-0.57% |
0.65% |
3.09% undervalued |
-5.93% |
15.78 |
|
-0.80% |
-0.04% |
8.29% |
4.44% undervalued |
-9.12% |
22.32 |
|
-1.09% |
-0.84% |
1.17% |
5.16% undervalued |
-10.75% |
22.02 |
|
-0.68% |
-2.03% |
3.64% |
5.43% undervalued |
-10.02% |
26.06 |
|
-1.78% |
-3.28% |
-1.99% |
9.10% undervalued |
-17.44% |
11.57 |
|
-1.40% |
-3.37% |
-6.50% |
10.65% undervalued |
-21.61% |
26.22 |
|
-0.63% |
-3.29% |
1.39% |
11.67% undervalued |
-28.97% |
13.70 |
|
-2.52% |
-2.93% |
-3.17% |
13.58% undervalued |
-16.43% |
21.70 |
ValuEngine.com is an independent research provider, producing buy/hold/sell recommendations, target price, and valuations on over 7,000 US and Canadian equities every trading day.
Visit www.ValuEngine.com for more information

|


